
This page features the most current data on Ohio jobs, wages and more. We update as soon as new data are available. These interactive charts are meant to be used! Use scrollbars or arrows to explore. Mouse over data points for details. Click on a chart or the icons below it to learn more. Cite as “Policy Matters Ohio analysis of publicly available data." Email Hannah Halbert with any questions about this information.
Productivity growth not reflected in compensation
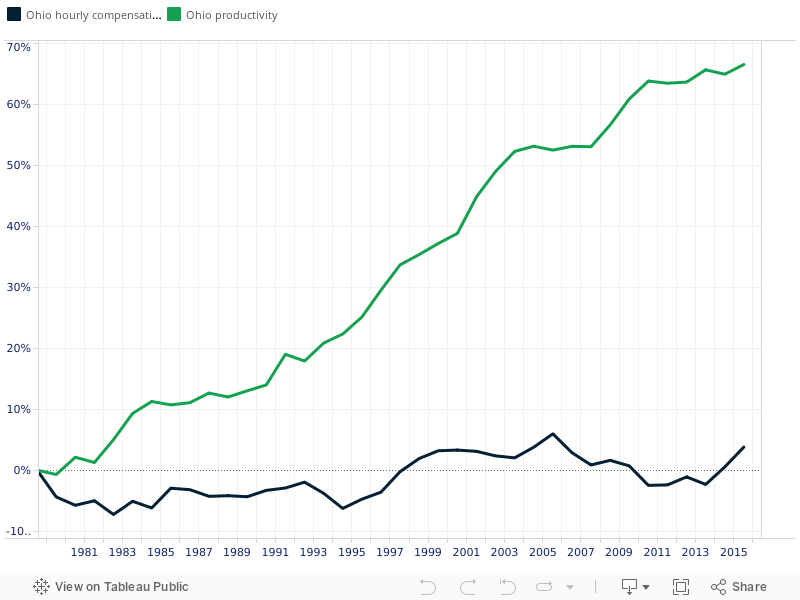
Source: Economic Policy Institute (EPI) analysis of data from Bureau of Labor Statistics, Labor Productivity and Costs program; Current Population Survey (CPS) and Bureau of Economic Analysis National Income and Product Accounts public data series. Changes cumulative. Latest data available. We can produce Ohio data only since 1979, where this chart begins. Chart ends in 2016. Inflation adjusted.
Ohio workers have grown more and more productive since 1979, but compensation has not followed suit. In fact, most of Ohio's most common jobs don't pay enough to lift a family of three out of the need for food assistance. For more, see Hannah Halbert's report, "Working for less: Too many jobs pay too little."
Ohio's shrinking workforce
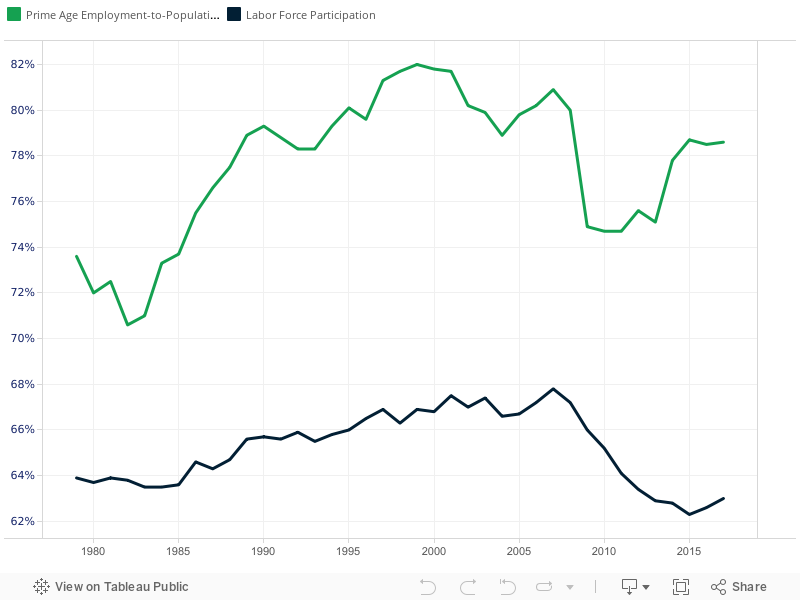
Source: Ohio Department of Job and Family Services, Local Area Unemployment Statistics (LAUS), available at http://ohiolmi.com/laus/laus.htm, current through 2017.
Though below its most recent peak — over 80% in 2007 — the prime-age (25-54) employment-to-population ratio (the share of Ohioans this age who have jobs) is up in recent years. Overall labor force participation remains low. Labor force participation includes those who are seeking employment but not working.
In other words, Ohio's job market is employing more people, but isn't pulling in all working-age adults.
For more, see the latest JobWatch report.
Slow slog out of the 2001 and 2007 recessions: Total jobs
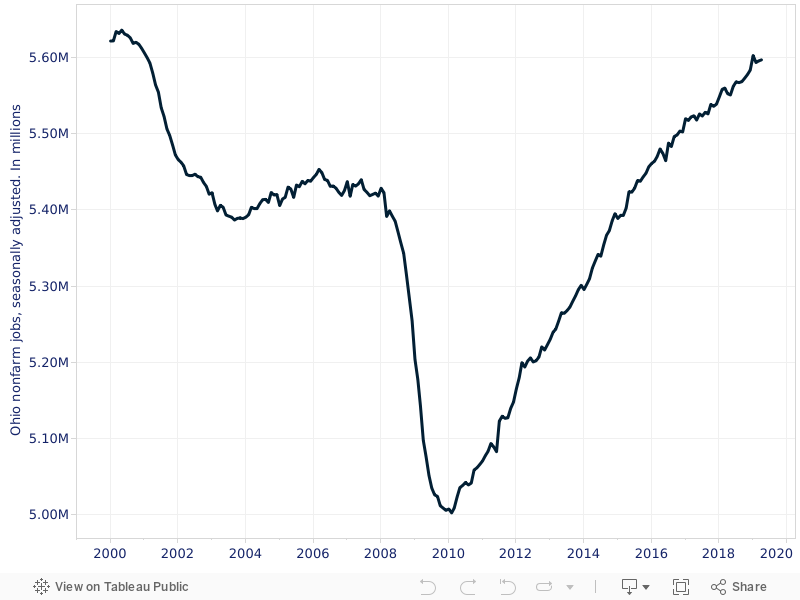
Source: Ohio Department of Job and Family Services, seasonally adjusted Current Employment Statistics (CES) Survey data, available at http://ohiolmi.com/ces/lmr.htm. Updated 2019.
Ohio's job numbers show a long, steady recovery from the devastating effects of the 2007 recession. We've fully recovered the number of jobs lost a decade ago, but haven't yet reached our 2000 peak.
For more, see the latest JobWatch report.
Ohio is among the slowest states in job creation since 2005
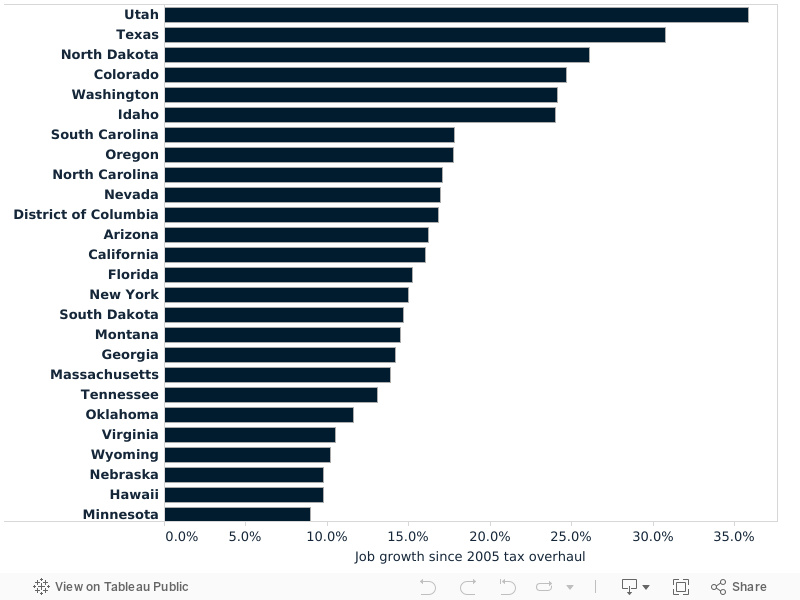
Source: Policy Matters Ohio ranking based on seasonally adjusted CES Survey data, available at https://www.bls.gov/ces/, ranking based on change in total nonfarm jobs between June 2005 through April 2019.
Only six other states have added jobs as slowly as Ohio has since lawmakers slashed Ohio taxes in 2005, saying that it would lead to job growth. Other slow-growing states include neighbors like West Virginia and Michigan, as well as states in other regions, like Connecticut and Mississippi.
For more, see the latest JobWatch report.
US and Ohio Unemployment Rates Near Historic Lows
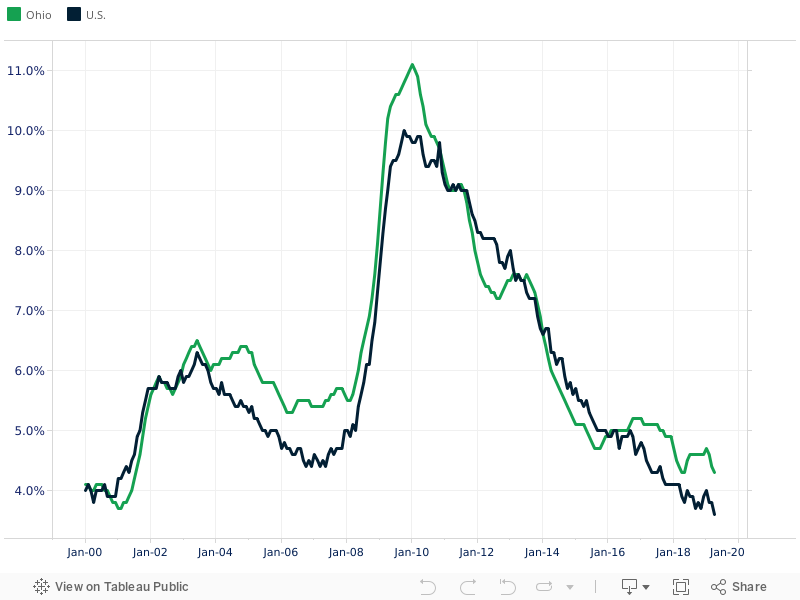
Source: CPS and LAUS data, available at https://www.bls.gov/cps/ and http://ohiolmi.com/laus/laus.htm, current through April 2019.
Unemployment is quite low in Ohio and nationally. Ohio started to underperform the nation in this metric in 2015. Ohio's rate continues to hit record lows, reaching 4.3% in April 2019, the lowest since July 2001.
For more, see the latest JobWatch report.
Ohio and national annual job growth since 1991: Still growing but slower in 2016 and 2017
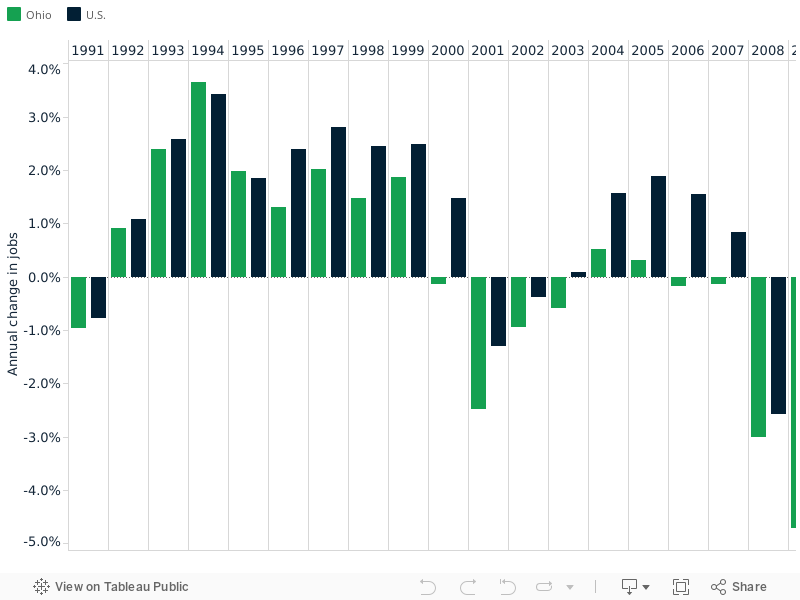
Source: Policy Matters Ohio based on annual change in seasonally adjusted nonfarm jobs, CES data available at https://www.bls.gov/ces/, updated May 2019.
Jobs typically grow in healthy economies. Over the past several decades, Ohio added jobs at a slower rate than the nation during expansions. We also lost a larger share of our jobs than the country did during downturns. Since 2010, both Ohio and the country added jobs every year, but the rate of growth in Ohio was faster during the early years of the expansion — 2010 through 2014 — than it has been more recently.
For more, see the State of Working Ohio, 2018.
Ohio wages down over a generation
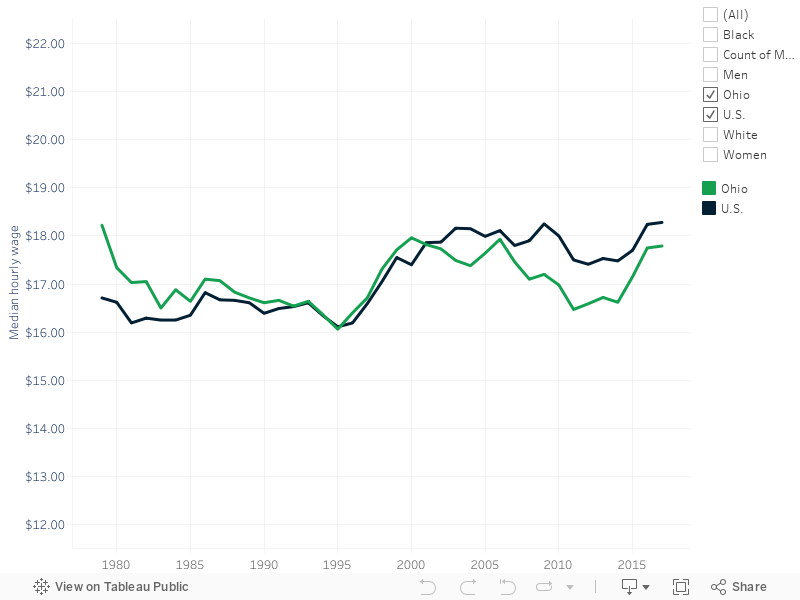
EPI analysis of CPS data, adjusted to 2017 dollars. Appears in Policy Matters Ohio 2018 State of Working Ohio report.
Ohio wages once exceeded those for the nation, but that trend has reversed. Many Ohioans today fare worse than their peers of a generation ago. Women are the exception: their hourly wages have grown by $2.83, but they still trail those of men. Men's wages have fallen, accounting for about half the closure of the gender wage gap. Wages for black Ohioans have fallen since 1979, and now trail those of white Ohioans by $4.61. People of color have been especially hard hit by loss of middle class jobs - especially in manufacturing - in their communities. Click the boxes to select populations.
Ohio and child poverty
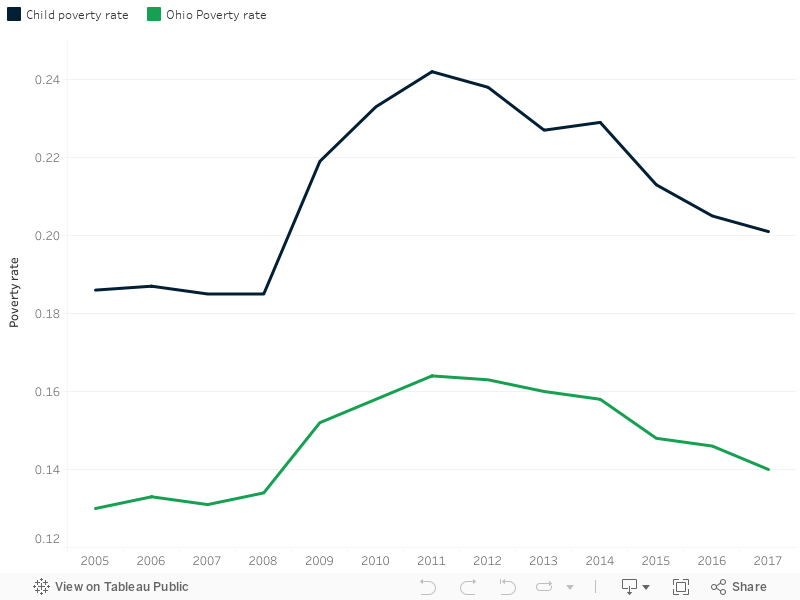
Source: American Community Survey 1-year
Poverty rates spiked during the 2008-2010 recession and have yet to return to pre-recession levels. One in five Ohio children continues to live in poverty.
Photo Gallery
1 of 22