Ohio schools cautiously rebuild
April 28, 2015
Ohio schools cautiously rebuild
April 28, 2015
Contact: Wendy Patton, 614.582.0048
By Wendy Patton
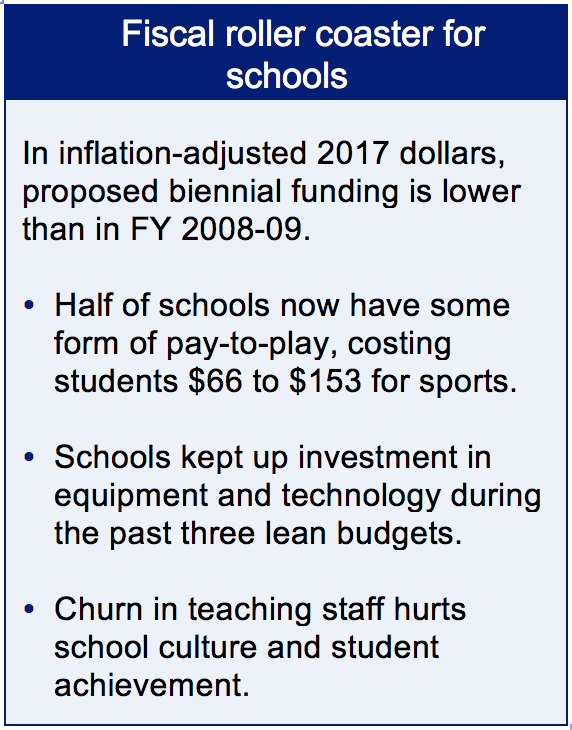 Ohio’s schools have seen a tough decade and although finances are looking better, it is not over yet. In nominal terms, state funding for schools would rise in the budget proposed for the next two years, but in inflation-adjusted (2017) dollars, funding passed by the House will be $447 million less than it was during the recessionary years of 2008-09.
The school funding formula has changed repeatedly over the past decade and inflation has eroded state support. These are uncertain times. Many public school districts are cautiously rebuilding: rehiring teachers, replenishing budget reserves and reinstating extracurricular activities. Others continue to reduce staff, rely on pay-to-play in extracurricular activities and struggle with budget deficits. Public schools face an uncertain future. Strategies undertaken because of the fiscal roller coaster can hurt school culture and student achievement.
Policy Matters Ohio periodically surveys schools about fiscal condition and operational strategies. The Ohio Association of School Business Officials provided a link to this survey in their newsletter of December 2014 through February 2015. Fifty-three respondents, representing 8.6 percent of districts and including representatives from all types of districts, or typologies, filled out the survey.
School districts are cautiously rebuilding as the state budget provides backfills for the deep cuts in FY 2012-13 and as local property values start to rise in some places. More schools are adding teachers at this point, but a third are still cutting teaching staff. Schools are adding extracurricular activities, but the practice of pay-to-play looks like it is here to stay. The Ohio High School Athletic Association reports that in 2014, 46 percent of high schools had some form of pay-to-play, with costs for sports up to $153 in some places. The percentage is about the same as in 2012.[1]
Uncertainty shapes strategy, which can work against outcomes. Student achievement can be hurt if teaching staff churns and if sports or drama club are too expensive for kids of modest income.
Ohio has seen four different funding formulas for classroom instruction since 2009. State aid has declined and property values remain low, keeping local revenue sources low. When superintendents face declining, stagnant or unpredictable budgets, they can’t move forward decisively, as explained by one survey respondent:
“The inability to provide a sound forecast past the current biennium budget is a very poor way to conduct business, yet that is the way we must operate in public schools.”
Financial roller coaster for Ohio’s public schools
Local revenues for schools were hurt by the recession and have not yet recovered. The recession stemmed from economic problems in the housing market, and the crash flattened growth in the value of taxable property. When the crash hit, it affected schools everywhere in the state. Figure 1 shows the trend in taxable property values in Ohio over the past decade. The state does not forecast recovery to 2008 levels until 2017.
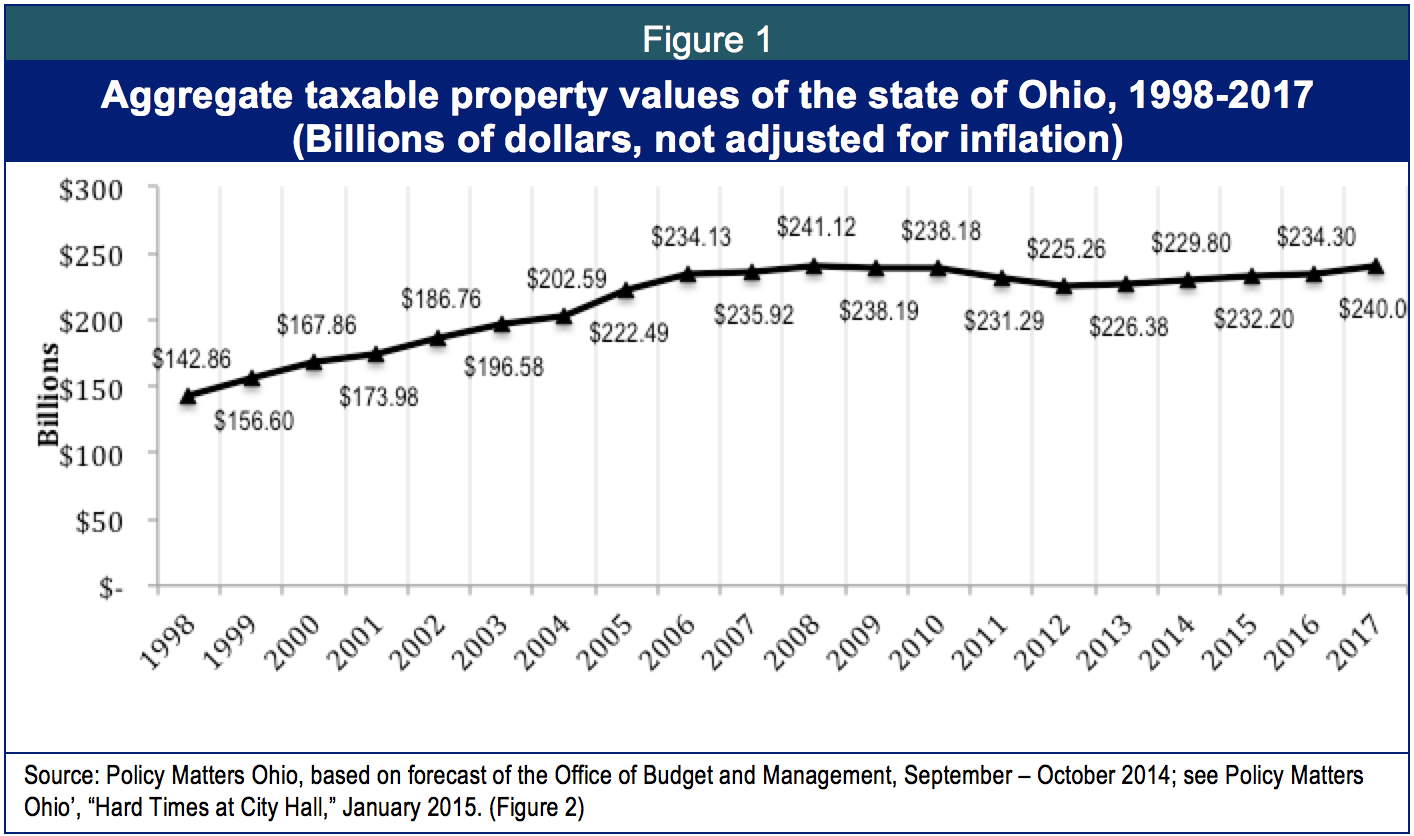
State and federal funds helped, but starting in FY 2012, aid plummeted. Federal recovery act dollars allowed the state to increase aid in FY 2010-11 as the property tax base fell. Figure 2 shows General Revenue Fund (GRF) and lottery profits formula funding and tax reimbursements[2] for public school districts, including Joint Vocational Districts, in the budgets for FY 2008-09 through the executive budget proposal for FY 2016-17. The most significant decline in state funding, in FY 2012-13, corresponded with the deepest dip in the local property tax base (See Figure 1, above). The state budget has restored much of its funding (not adjusted for inflation), but according to a forecast last fall by Ohio’s Office of Budget and Management, property values will not recover to the level of 2008 until 2017.[3]

Inflation-adjusted state funding has declined.
Basic state support for schools: formula funding and tax reimbursements,[4] would grow in the FY 2016-17 budget (as passed by the House) by about $1.4 billion (nominal dollars) compared to the FY 2014-15 budget. Figure 2 shows that when adjusted for inflation, basic support for schools has fallen by nearly a half billion ($447.5 million) since the budget of the recessionary years of (FY 2008-09). In terms of total, “all-funds” allocations for the Ohio Department of Education, including federal funds, support for the Ohio Department of Education is $2.95 billion or 11.7 percent lower in the house-proposed budget for FY 2016–17 than in FY 2008-09 in inflation-adjusted (2017) dollars.[5]
Schools face new and ongoing threats to state funding. When students move to charter schools[6] or neighboring schools under open enrollment policies,[7] state funding follows them. The executive budget phases out tax reimbursements, promised a decade ago when the legislature dismantled local taxes on business equipment and machinery. Although the House budget would restore some of the loss, the language structuring the ultimate phase-out is left in. The last budget limited property tax relief (the property tax rollback) for school levies that raise new revenues, making it harder for schools to go to the polls.
In addition, there are new challenges to finances. A survey respondent outlined challenges: “Open Enrollment”and solvency assistance repayments eat up over 21% of our budget. Another 15% is spent strictly on special education. This doesn't leave enough over to operate.” [8]
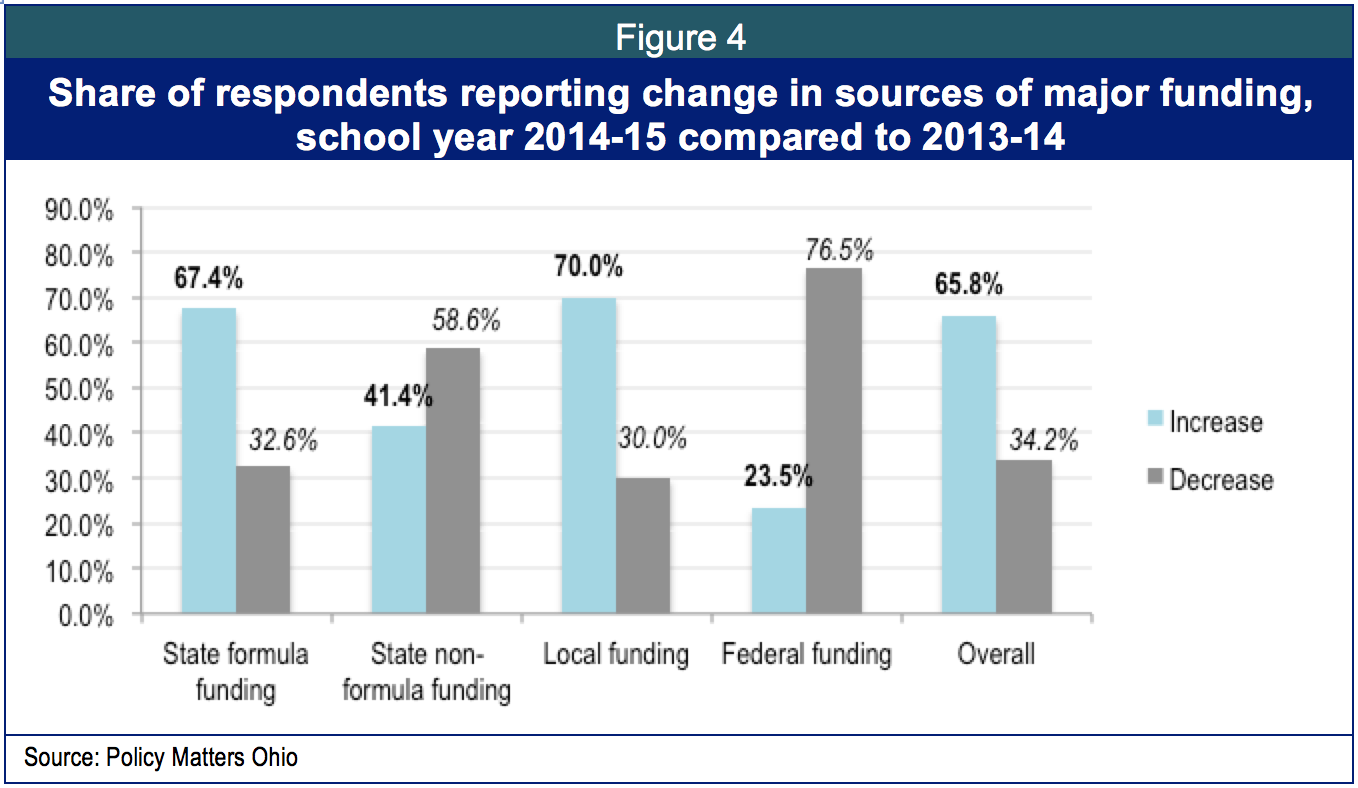
About two-thirds of respondents to our survey question on per-pupil funding reported an overall increase in in the current school year compared to last year. About the same share (67.4 percent) reported increases in state formula funding this year compared to last, but the majority of respondents – 58.6 percent – reported a decrease in non-formula state funding. Local funding per pupil rose for 70 percent of respondents while federal funding fell by 76.5 percent. Overall, two-thirds of respondents (65.8 percent) reported increased resources per pupil in the current year compared to the last. This leaves over a third – 34.2 percent – with decreased funding (Figure 4).
Respondents named the school funding formula guarantee,[9] increases in agricultural property taxes,[10] enrollment changes due to open enrollment policies, and new funds from levies and sales of tax liens as factors strengthening local revenues. Respondents also described significant downsizing since the recession, suggesting the appropriate frame of reference for the survey would go back to school year 2008-09 to capture changes in revenue over time.
Over a quarter of respondents that had lost state funds on a per-pupil basis in FY 2014-15 compared to FY 2013-14 made up for that loss by increasing other revenue streams (Figure 5). The primary source for fund replacement was local resources: 35.7 percent had passed or increased a levy and 57.1 percent saw increased local revenues as a result of an increase in local property values. Others mentioned increases in state non-formula funding, new federal revenues or other grant funds.

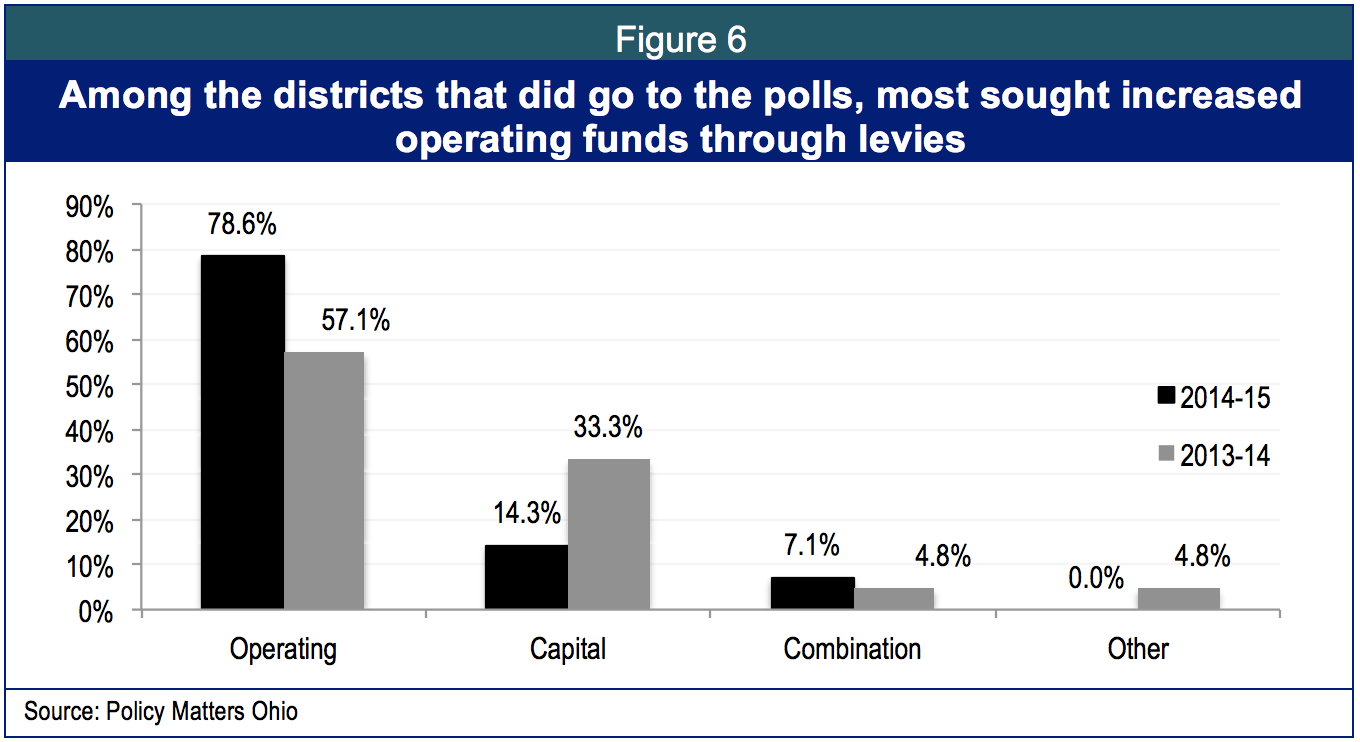
Local Levies: About a third of the respondents to the question on local levy activity went to the polls in 2013-14 and a little over a quarter went to the polls in 2014-15 to seek additional local funds. Most of these districts sought operating funds: 57.1 percent in 2013-14, rising to 78.6 percent in 2014-15 (Figure 6).
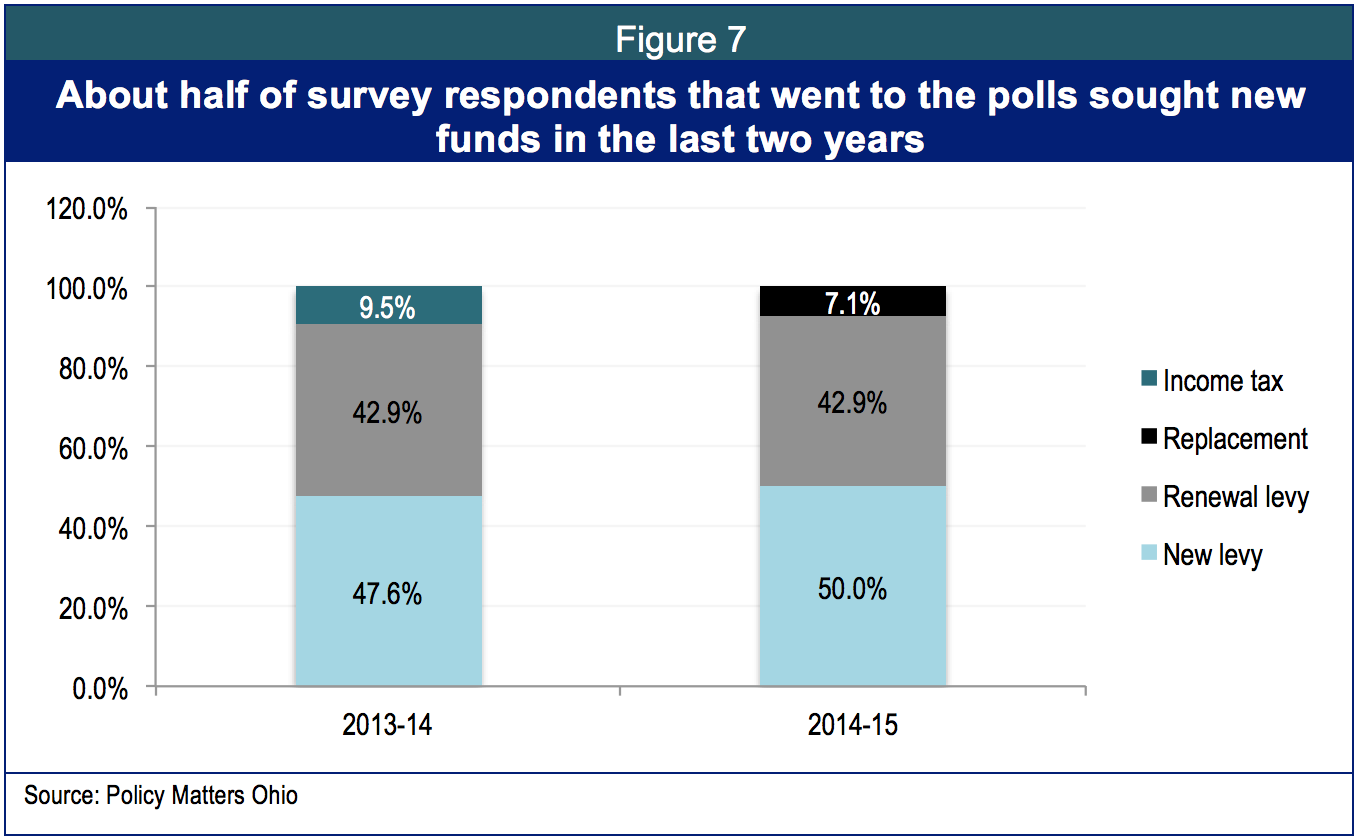
The share of respondents seeking new levies rose in the current year compared to last year. In school year 2013-14, 47.6 percent of respondents who went to the polls sought new levies, 42.9 percent sought renewals of existing levies and 9.5 percent sought an income tax change. In 2014-15, 50 percent sought new funds, 42.9 percent sought renewals and 7 percent sought replacement levies (Figure 7).
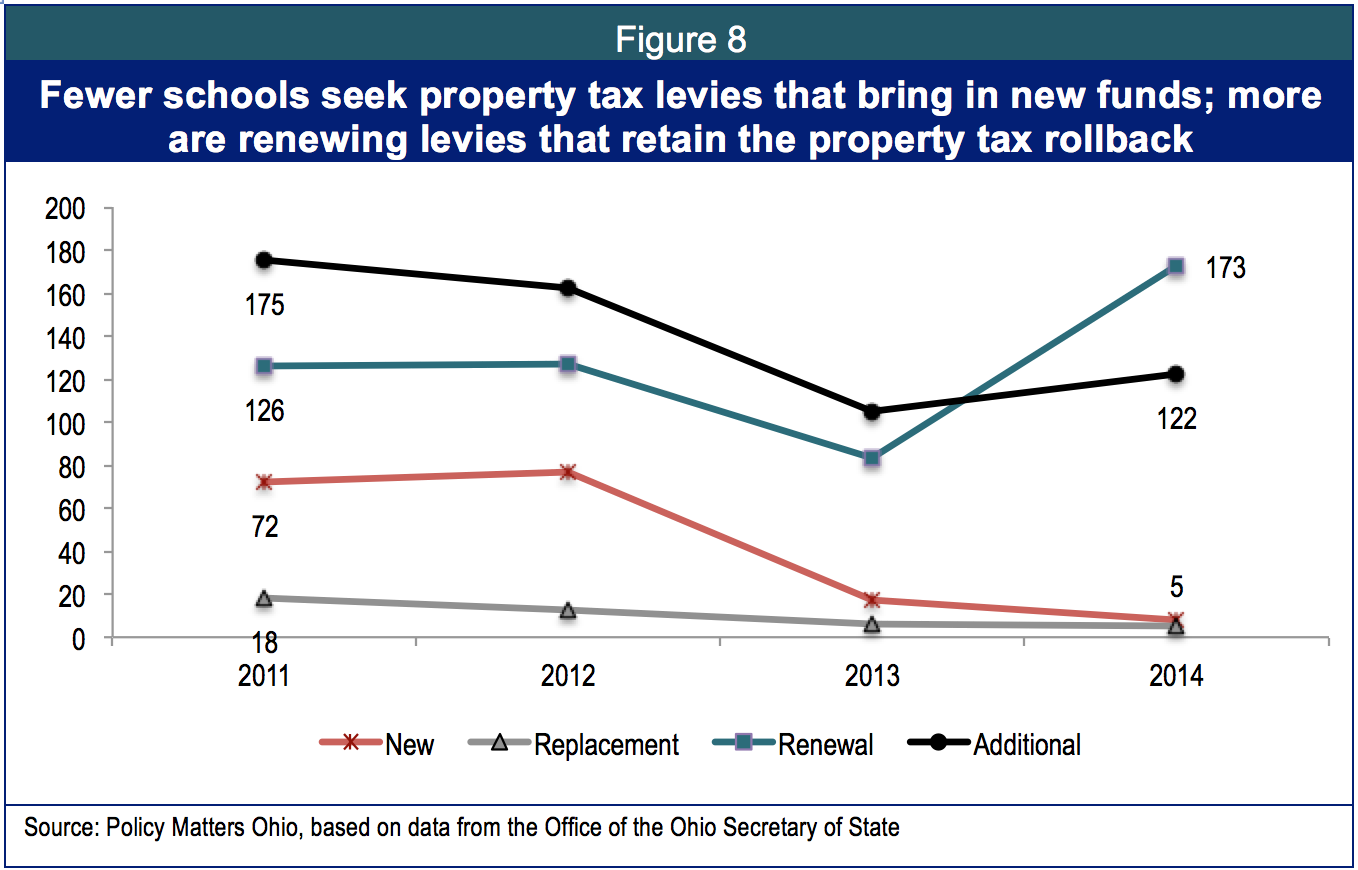
The state budget bill for FY 2014-15 limited the “property tax rollback,” tax relief of up to 12.5 percent for residential properties, with owner-occupants getting a little more aid than owners of other residential properties. The limits apply to levies that raise new funds; renewal levies are not affected. As of the November elections, data from the Secretary of State indicated that across all elections, fewer schools are seeking new monies at the polls. Instead, they are seeking renewal levies, which still bear the property tax relief (Figure 8).
Respondents discussed the challenge of going to the polls. One respondent highlighted the difficulty in passing levies:
“[We have experienced] an inability to pass new operating levies…Have failed three in 1.5 years.”
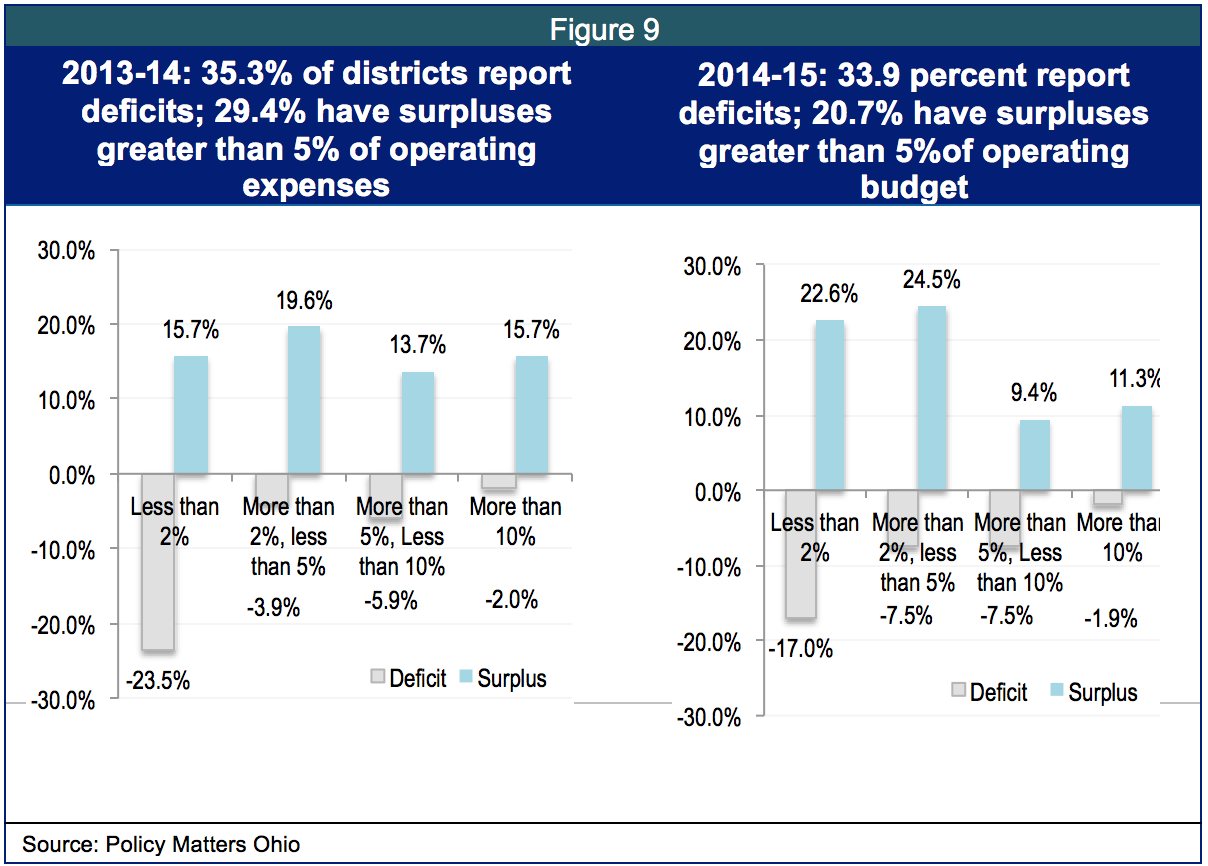
Surpluses: About two-thirds of respondents reported a budget surplus in school year 2013-14 (64.7 percent) and the ratio was about the same in 2014-15 (67 percent). A little over a third of respondents had a deficit last year and expect to have one this school year as well. Figure 9 illustrates size of deficit or surplus as a share of operating expense. . In school year 2013-14, the share of districts with surpluses over 5 percent of operating budgets fell as districts cautiously rebuilt, hiring teachers and restoring extracurricular activities.
Budget reserves: An open-ended response provided in response to the question: “Why have there been changes in budget reserves,” illustrates the increasingly critical role of a cash reserve in uncertain times:
“[We] passed a levy that was half of what was needed and used cash balances to make up the difference. We got down to less than $1MM this month and payroll is $2.5M/month. We had to beg for tax advances to cover payroll.”
School districts that finish a school year without a surplus may have financial difficulties because of payment timing of the main funding source: local property taxes, which come in twice a year. Almost two–thirds of respondents (64 percent) have budget reserves at or less than recommended levels of 16.2 percent of operating budget.[11] Just over 40 percent of respondents who answered the question on budget reserves have reserve funds of less than 5 percent. Another 24 percent have reserve funds of less than a fifth of their budget. Only 19 percent have reserves of more than 30 percent of their budget.
The Kasich administration has suggested schools use budget reserves if they face shortfalls in the new school funding formula. However, this is not how finance experts recommend that reserves be used. The Government Finance Officers Association states that balances can vary depending on size of entity, savings for projects, and other factors.[12] A Columbus Dispatch analysis pointed out that districts’ cash-balance numbers can vary depending on where they are in a levy cycle. Districts in which voters recently passed a levy tend to carry over more money in the early years to use in later years because levies do not grow with inflation as expenses do.[13]
Budget reserve policies: Nine of the 53 respondents have a formal budget reserve policy. Several respondents indicated that although they do not have a budget reserve policy, they are working towards formalizing one. Table A-2 in the appendix gives information on the budget reserve policies reported in the survey. Open-ended responses on budget reserve policies varied greatly:
“Board and Administrative commitment to create a fund balance of three to six months of operating budget. It is not a Board policy, but a decision communicated by the Treasurer.”
“There is no reserve. We could file bankruptcy if that were allowed.”
Bond ratings: Most respondents had not seen a change in their bond rating. Four reported a downgrading and three reported upgrading. The balance of respondents reported no change.
Changing finances, changing strategies
Like any organization, schools can make changes in capital, equipment, staffing and services in response to fiscal needs. Below we report on responses about changes in these and other areas.
Changes in staffing patterns
Elementary and secondary education is labor intensive, with 83 percent of funding, on average, going to payroll. [14] Funding for K-12 education was dramatically reduced in FY 2012-13, and schools laid off staff and froze or cut benefits. In the survey Policy Matters conducted in 2012-13, 84 percent of responding districts had reduced or frozen compensation and 82 percent had reduced staff.[15] The situation has improved since then. Figures 10, 11 and 12 illustrate changes in staffing reported in 2013-14 and 2014-15.
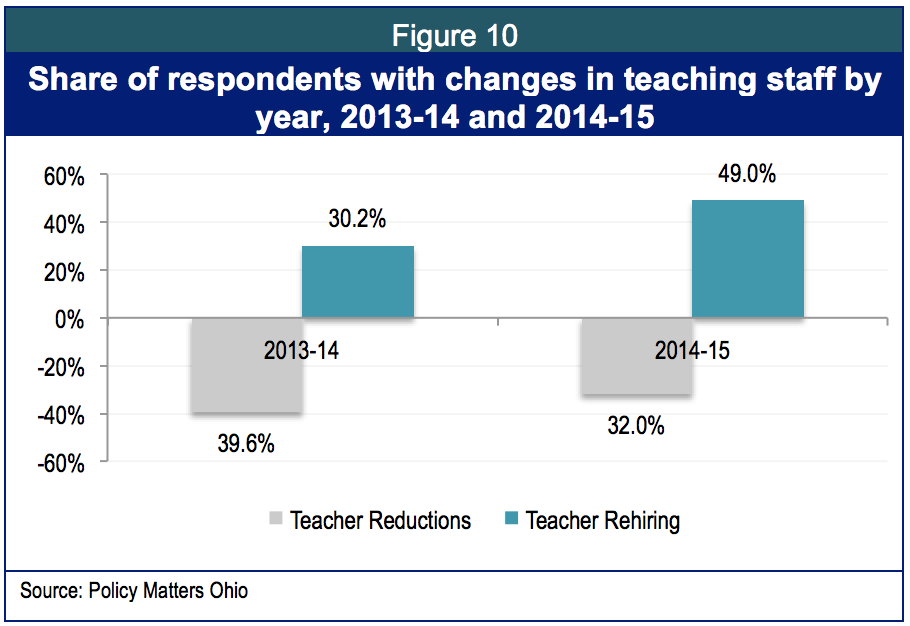
Teaching staff: Last school year (2013-14), more schools were still laying teaching staff off than were replacing teachers in the classroom (Figure 10). About 40 percent of school officials responding to this question reduced teaching staff. This represents a slowing in reduction: In 2012-13, 60 percent had reduced teaching staff.
In school year 2014-15, the current school year, more respondents reported adding teachers instead of reducing teaching staff. Almost half (49 percent) of districts responding to this question reported adding teaching staff in 2014-15. A third still reported reducing teaching staff.
Open-ended responses on finances highlighted the role of staff and staff costs in strategies to balance the budget.
“We have already lost most of our TPP replacements. However, it had a very large impact and was coupled with the 10% state funding cuts from a couple of years ago. We made staffing cuts to balance the budget and still have not been able to replace those staff members. Currently, we are still being affected by local tax losses due to valuation decreases and delinquent property taxes”
“[We undertake] constant review of the budget/staff turnover. Changes in health care (reductions), more efficient use of non-teaching staff and alternate salary schedules for new hires.”
Long-term teachers create a culture within a school and develop mentoring relationships with other staff. Churning in teaching staff can disrupt teamwork, undermine stability, and hurt achievement.[16] A recent study, presented at a conference held by the Center for Longitudinal Data in Education Research, found long-term data supported the following findings:[17]
- Students taught by teachers in the same grade-level team in the same school did worse in years where turnover rates were higher, compared with years with less teacher turnover.
- An increase in teacher turnover by 1 standard deviation corresponded with a decrease in math achievement of 2 percent of a standard deviation; students in grade levels with 100 percent turnover were especially affected, with lower test scores by anywhere from 6 percent to 10 percent of a standard deviation based on the content area.
- Large and small schools, new and old ones, had these same outcomes.
- The negative effect of turnover on student achievement was larger in schools with more low-achieving and black students.
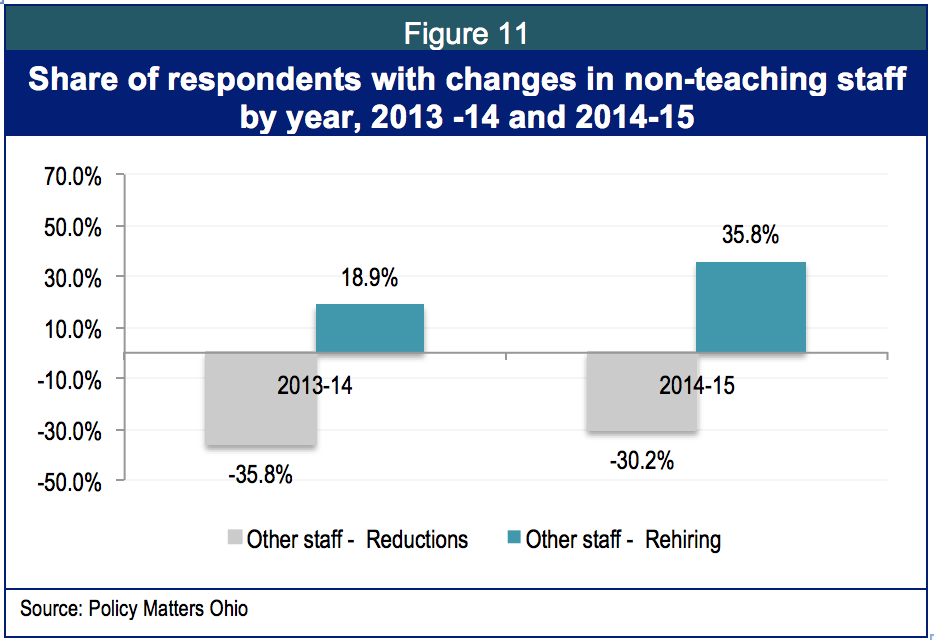
There is little research on the role of non-teaching staff in the primary and secondary school. A 2010 study of the Thomas Fordham Institute questioned their value to student outcomes, but acknowledged a small share of growth in non-teaching staff was due to the growth in special education.[18] An open-ended response to this survey highlighted the role of providing special education in times of fiscal stress:
- “[Public schools lose funds to] Jon Peterson scholarships and autism voucher. An increasing amount of staff time is devoted to this process [special education] which is not reimbursed … from by the State.”
- “[We have been affected by the] reduction of Federal dollars for special education.”
Administrative staff: The lowest level of both reduction and restoration was among administrators (Figure 12) and shows the same trends as in the other two categories. More administrative positions were reduced in 2013-14 than added, but in the current year, more administrators are being added than reduced, possibly because of increased emphasis on teacher evaluation and possibly because restoration of state funding is allowing schools to add more highly compensated positions.
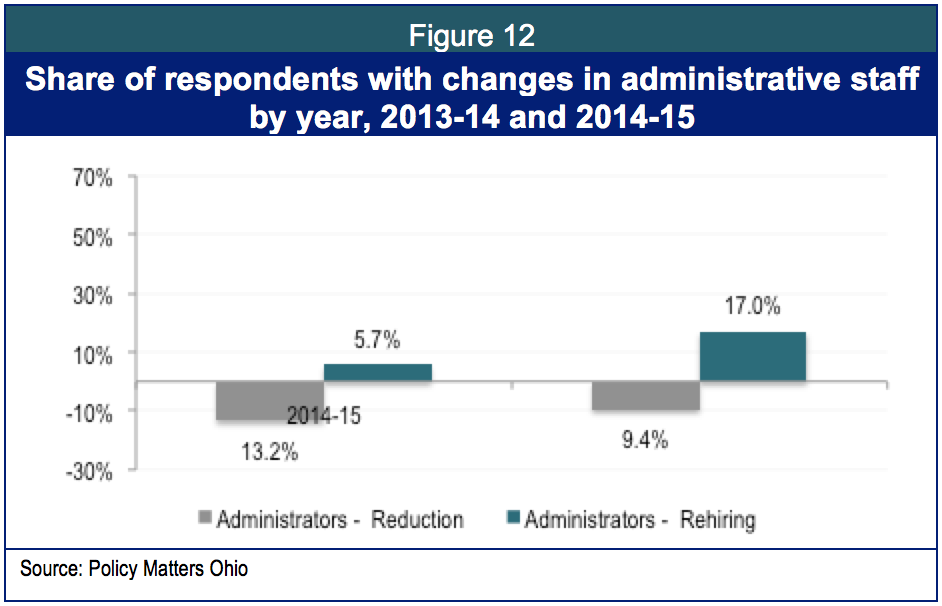
Figure 13 compares changes in occupational groupings within respondents’ schools over time (school year 2011-12 through 2014-15). This highest rate of reduction was in non-professional staff, followed by non-core teachers. Almost a quarter of respondents have more teachers today than in school year 2011-12 while 31 percent reported having fewer. A much larger share of respondents reported fewer personnel in all other categories than those reporting more.

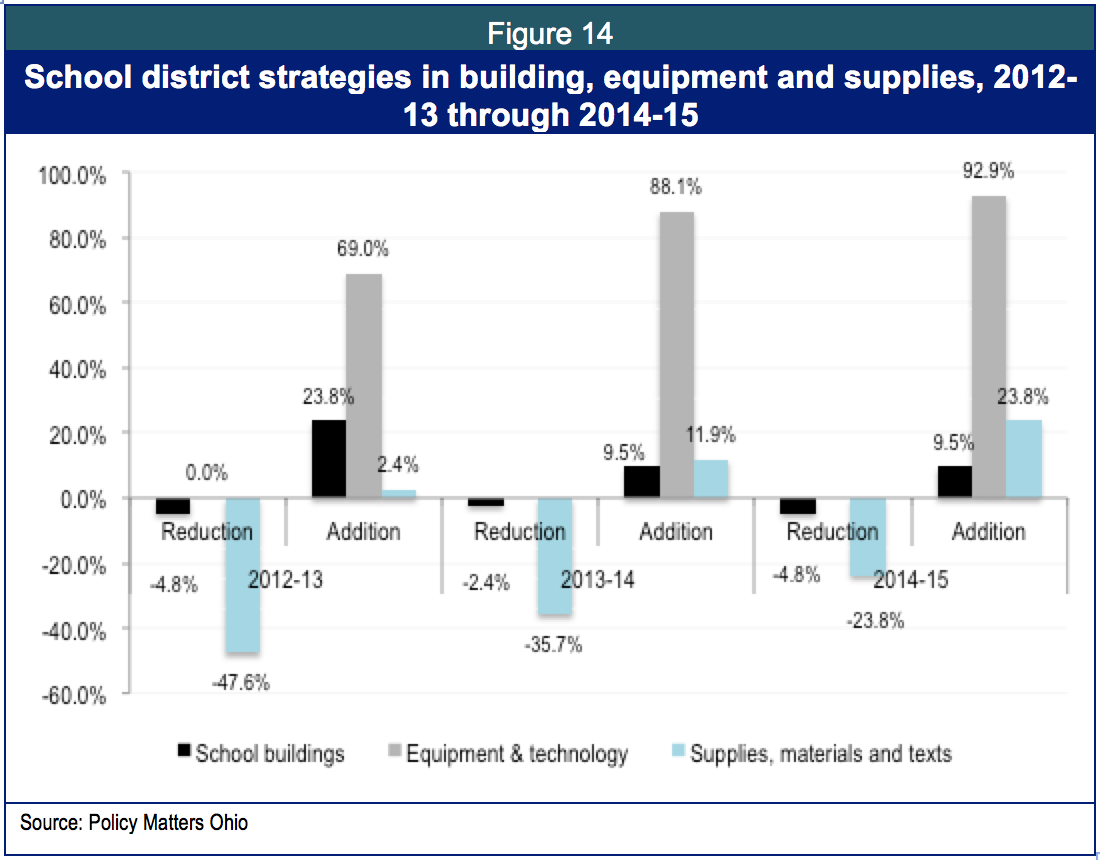
Building, equipment and supplies: Less than 5 percent of respondents reported building closures during the changing fiscal conditions of the past 5 years. In 2012-13, 23.2 percent reported expanding or improving buildings. Long-term financing for capital improvements is unrelated to swings in operating budgets (Figure 14).
Nearly half (47.6 percent) of the respondents to this question reduced purchases of supplies, materials and texts in 2012-13, a share that dropped in subsequent years.
Districts did make deep investments in equipment and technology in part because of new requirements. A majority of respondents kept investing in equipment and technology in all three years, with 92.9 percent investing in upgrades in the current year. A respondent highlighted the role of new mandates in this investment:
“Purchasing of computers to meet student needs for PARCC[20] assessments has been a major cost….”
Sixteen out of fifty-three respondents had received Straight A grant funds from state non-formula funding. The Straight A fund provides grants for innovative projects. Funded by the state lottery, the executive budget proposal for Straight A funds is $200 million over the biennium. Of those receiving such funds, the largest single category – one third – used the funds for technology.
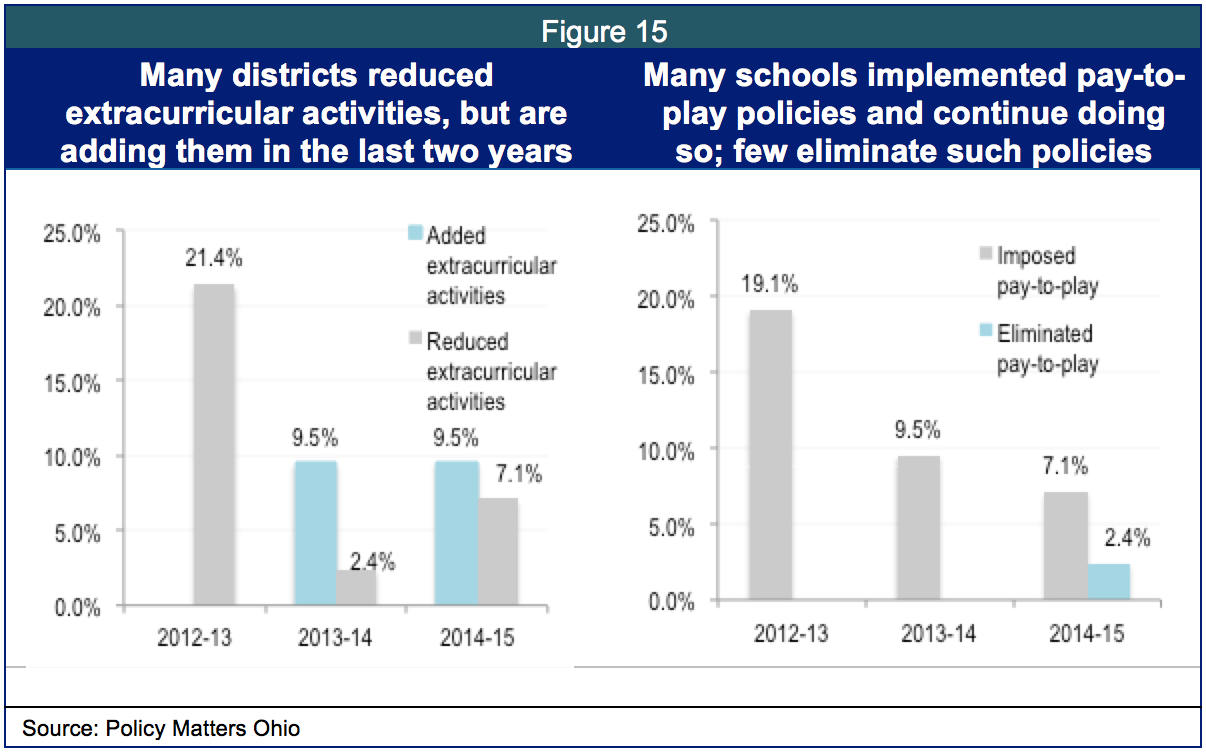
Extracurricular activities and pay-to-play: About a fifth of those who responded to this question reduced extracurricular activities in 2012-13 and imposed pay-to-play for such activities in the same year (Figure 15). Some respondents added extracurricular activities in subsequent years, but few did away with pay-to-play. This may be a strategy institutionalized by hard times in many schools.
Research has identified significant benefits associated with participation in extracurricular activities.[21] The National Center for Educational Statistics (NCES) reported that students who participated in extracurriculars did significantly better than non-participating peers in truancy, anticipation of post-secondary education, grade point average, and math and reading test scores.[22]
NCES also reported that participation in these activities remained low for poor and minority students, particularly problematic because of their potential benefits to such students. Extracurricular activities build connections to the school community, and help to overcome one of the most frequently stated reasons students give for dropping out of school: “I felt like I didn’t belong there.”
In June of 2014, the Ohio High School Athletic Association heard from 471 athletic directors across Ohio’s school districts. Just under half (46 percent) indicated their school had instituted some kind of pay-to-play policy. Fees ranged from an average of $66 in some places to an average of $153 in others.[23] Fees like this can preclude students from the lowest-income families – the ones who need extracurricular activities the most – from participating.
Hours of instruction: Less than 5 percent of respondents reported either reduction or addition of hours of instruction. More respondents added summer programming than reduced such programming in all three years, although few reported either increase or decrease. Increased summer programming may reflect efforts to help children pass the Third Grade Reading Guarantee.
New challenges and opportunities
New challenges to Ohio’s public schools include meeting requirements of the third grade reading guarantee, preparing for the Common Core curriculum, participating in PARCC and losing students and funding to open enrollment, charter and private schools. Opportunities include new sources of grant funds, such as the Straight A fund.
- Third grade reading guarantee: Seventy-nine percent of respondents report that preparing students to pass the third grade reading guarantee is taking new investment. Funds from internal sources – other program areas – fund 91 percent of this effort. There are state funds for early literacy in the budget, but respondents are reaching beyond those funds and tapping other sources.
- Transportation budget: Half of respondents reported increased investment in transportation equipment in the current year A little more than two thirds saw no real change in transportation for after-school activities, services for high school students and services for charter school and private students. However, 20 percent – a significant minority – did see added costs associated with transportation for charter and private school students.
- Common core: Eighty-four percent of respondents have dedicated new resources to preparation for the Common Core Curriculum. External sources support about a third of the preparation.
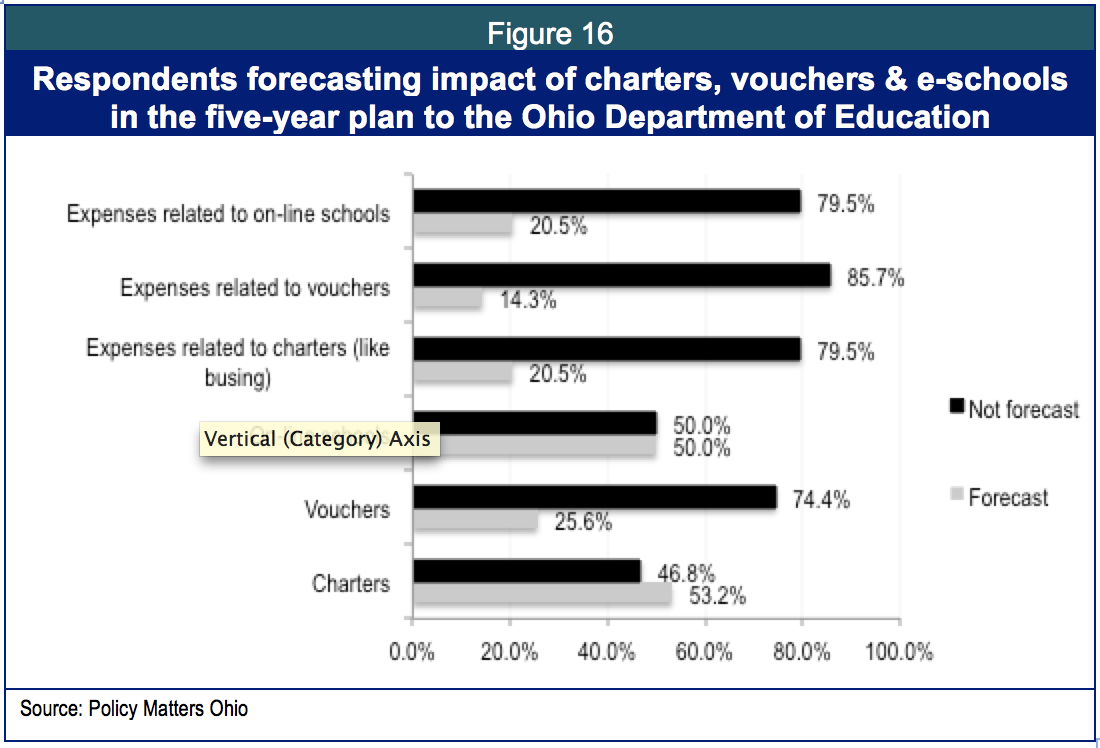
- Charters, vouchers and e-schools: Respondents have seen 11,187 students go to charters and 1,935 students use the voucher program for private schools. Over 22,000 have enrolled in e-schools. By now, more than half of all schools forecast number of charter school students in the five-year plans they submit to the Ohio Department of Education, but less than half forecast other categories and expenses (Figure 16).
- Pre-K and full day kindergarten: 92 percent of respondents offered full day kindergarten and 87 percent offered pre-K services. The question did not differentiate between type of program – special education or other. Of those respondents who do not offer full-day kindergarten, 100 percent would like to do so. Of those who do not offer pre-K services, 62 percent would like to.
- Guarantee Funds: The “guarantee” in the state school funding formula is transitional aid to districts losing revenues to help ‘smooth out’ their budgets. This is a $169 million program the current school year.[24] Fifty-three percent of respondents receive guarantee funds. Of those that do receive the guarantee, 85 percent believe loss of that component of the formula would affect their operations. Most worry that continuation of the guarantee is questionable.
In FY 2015, there are 198 districts receiving the guarantee, referred to as “temporary transitional aid” in the governor’s budget proposal. The Legislative Service Commission estimates 226 will receive this type of funding in FY 2016 under the governor’s proposal, but only 184 in 2017.[25]
- Local special assessments (Tax Increment Financing or “TIF”) and/or property tax abatement: TIFs affect the operating budgets of 40 percent of respondents to this question. TIF is a common economic development tool used to incentivize development of industrial and commercial property. Property tax revenue is siphoned off for economic development rather than directed to schools.
About a third of districts (34.5 percent) impacted by these economic development policies receive payments in lieu of taxes that adequately replace such loss of revenue. Almost two thirds (64.5 percent) do not receive adequate replacement. While 95 percent of respondents reported that these policies have a minor effect on operations, one respondent highlighted the impact on his/her district:
“We do receive PILOTs but they are not "sufficient to replace revenues exempted"
- Loss of tangible personal property (TPP) tax replacements: The primary source of revenue for public schools is the property tax. The state reduced the tax on utility equipment and machinery and eliminated the tax on business machinery and equipment in 2005, and reimbursed schools for this loss for many years, but the proposed budget for FY 2016-17 phases out tax reimbursements over the next several years.
Summary and conclusions
School business officials who responded to the Policy Matters Ohio survey reported improved overall funding per pupil in the current year compared to the last. However, many noted that balanced budgets and stabilized finances have come at a cost of reduced staff and operations. As one would expect, some schools went to the polls to get additional local funding. Others tried other strategies in response to the lagging local property values and state aid.
The stability and adequacy of state support for services delivered locally, like public education, matters to quality of life for families and future opportunity for the children of the state. Ohio has seen four different funding formulas for classroom instruction since 2009. Key sources of funding for many schools, like the guarantee, is in question. New mandates take resources. Weakness in the property tax base and loss of the property tax rollback for new levy funds contribute to fiscal uncertainty.
There were deep cuts to state funding. While there has been some restoration since the lowest point, in aggregate, state formula funding plus tax reimbursements have declined when adjusted for inflation. New demands like the third grade reading guarantee, PARRC and preparation for the Common Core have forced some districts to take resources from other program areas.
Although restoration of most of the deepest state cuts allowed many schools to restore teaching staff, the churning of teachers, loss of support staff and institutionalization of strategies like pay-to-play could cause lasting damage in some schools that can hurt student achievement, with the worst effect on families of modest and low income.
Ohio is only as competitive as its citizens. Quantitative research demonstrates that states with the highest levels of education have the highest median wages of residents.[26]
Lawmakers can contribute to growing Ohio’s wages and economy by creating an equitable school funding formula based on the actual costs of a good education. We should then abide by that formula and fund it adequately to allow schools to stabilize and focus on the priorities: educating our children for a challenging future.
Appendix:
Survey respondents
The Ohio Association of School Business Officials provided a link to the survey in their December and January newsletter, and sent out an e-mail specifically on the survey in February. Respondents self-selected. Fifty-three respondents, representing 8.6 percent of districts, filled out the survey. Figure A-1 shows the share of respondents by school district typology.

Survey form
- Thank you for taking the time to fill out this survey. Your responses will help us better understand how school districts are doing in a tough economic environment. This survey, which is being made available to all school districts through the OASBO newsletter, will be the basis of a Policy Matters Ohio report that will be issued in 2015. No individual school district data will be released to the public unless permission is provided in writing. If you work for or represent more than one district or entity, please fill out a separate survey for each. Please provide your name and title in the box below.
- Name of district
- Typology
- Rural - High Student Poverty & Small Student Population
- (2)Rural - Average Student Poverty & Very Small Student Population
- (3)Small Town - Low Student Poverty & Small Student Population
- (4)Small Town - High Student Poverty & Average Student Population Size
- (5)Suburban - Low Student Poverty & Average Student Population Size
- (6)Suburban - Very Low Student Poverty & Large Student Population
- (7)Urban - High Student Poverty & Average Student Population
- (8)Urban - Very High Student Poverty & Very Large Student Population
- Type of district or entity
- "city school districts,"
- Local school district
- Exempted village school district
- Cooperative education school district
- Joint vocational school districts
- Vocational school district
- Educational service center
- Please indicate if there have been changes in personnel, capital equipment. facilities, technology or operations. (Each row may have multiple answers, or there may be no answer if there was no change in the category indicated.)
| · Teachers - Layoffs or reduction in force through attrition |
| · Teachers - New hires or recall of layoffs |
| · Other staff - Layoffs or reduction in force through attrition |
| · Other staff - New hires or recall of layoffs |
| · Administrators - Layoffs or reduction in force through attrition |
| · Administrators - New hires or recall from layoff |
| · School buildings - Built, expanded or improved |
| · School buildings - Closed |
| · Classroom equipment and technology - New investment |
| · Hours of instruction - Expanded |
| · Hours of instruction - Reduced |
| · Extracurricular activities - Expanded |
| · Extracurricular activities - Reduced |
| · Extracurricular activities - Pay to play implemented |
| · Extracurricular activities - Pay to play ended |
| · Supplies, materials and texts - Reduced |
| · Supplies, materials and texts - Expanded |
| · Summer programming - Expanded |
| · Summer programming - Reduced |
- What occupations have been the most affected by change in district finances since school year 2011-12? (If no change leave category blank.) Forty-two respondents completed this question
| · Teachers of core subjects (math, science, writing, history) |
| · Teachers of non-core subjects (art, music, language, gym, reading, etc.) |
| · Non-professional staff (clerical, janitorial, aides, bus drivers, etc.) |
| · Professional staff (library, guidance counselors, social workers, nurses) |
| · Administrators |
| · Other |
- What is your operating budget for school year 2014-15? (52 responses)
- Did your district face an operating budget deficit or surplus last year (School Year 2013-14)?
- 0 - <5% of operating budget
- >5% - <10%
- >10% - <20%
- >20%
- Do you expect to have an operating budget deficit or surplus this year (School year 2014-15)? (53 responses)
- 0 - <5% of operating budget
- >5% - <10%
- >10% - <20%
- >20%
- Has there been an increase or decrease in per-pupil funding in each of the four categories listed below in the current school year (2014-15) relative to the prior school year (2013-14)?
| · State formula funding |
| · State non-formula funding |
| · Local funding |
| · Federal funding |
| · Overall funding. Other (please specify) |
- If there has been an overall per-pupil increase in funding but a decrease in state per-pupil formula funding, please check box or boxes that best explain the differences. (14 responses)
- Passed a new or increased levy
- Increase in local property values
- Increase in state non-formula funding
- New federal revenues
- Other grant funds
- Other (please specify)
- Did you seek new local tax revenues last year (SY 2013-14)? (45 responses)
- Will you seek additional local revenues this year (SY 2014-15)? (43 responses)
- Has your bond rating changed since school year 2010-11? What was it then, and what is it now? (38 responses)
- Do you have an official (board adopted) policy about the size of the reserve fund you want to maintain? (51 responses)
- Rainy day or unassigned reserve fund as a share of operating budget – for school years 2013-14, 2014-15 (38 responses)
- 0 - <5% of operating budget
- >5% - <10%
- >10% - <20%
- >20%
- >30%
- What are the reasons for change in reserve fund balance? (28 responses)
- Has your district needed additional resources for the third-grade reading guarantee? (52 responses)
- If your district needs resources to meet the requirements of the third-grade reading guarantee, where will such resources come from? (46 responses)
- Internal sources (reduced spending in other programs)
- External sources
- Has your transportation budget grown since school year 2011-12, or has it shrunk? Have changes been due to any of the following factors: (51 responses)
| · Service for after-school programs | ||
| · Service for high school students | ||
| · Services for charter/private schools | ||
| · Equipment purchases/replacements | ||
- Assuming the common core curriculum stays in place, has your district provided new resources to prepare for the new standards? (52 responses)
- If your district needs new resources for common core, where will such resources come from? (50 responses)
- Internal sources (reduced spending in other programs)
- External sources
- Did your district lose funding in the current school year due to charters, vouchers or on-line schools? (put numbers in the boxes without dollar signs, commas or decimal points).
- Charters (students)
- Vouchers ($$)
- Vouchers (students)
- On-line schools ($$)
- On-line schools (students)
- Did you include an increase of funding for charters, vouchers and on-line schools in your five-year forecast? (48 responses)
- Has your district received Straight A funds? (52 responses)
- If your district has received Straight A funds, what was it for? (17 responses)
- Full day kindergarten and pre-K (51 responses)
| · Do you offer full day kindergarten? | |
| · Do you offer pre-K classrooms? | |
| · Would you like to offer full-day kindergarten? | |
| · Would you like to offer full-day pre-K? | |
- "Guarantee" or "Hold Harmless" funding (51 responses)
| · Does your district receive Guarantee or Hold Harmless dollars in state funding? |
| · Do you feel there is uncertainty around the continuity of this funding? |
| · If yes, does this affect decisions about school operations? |
- Other (please specify)
- Is your school district impacted by reduction in property value because of business incentives? (49 responses)
| · Tax Incentive Financing (TIF) district |
| · Other property tax abatements |
- Other (please specify)
- If yes, do you receive payments in lieu of taxes that are sufficient to replace the revenues exempted or diverted? (31 responses)
- Is the impact of tax abatements or Tax Increment Financing or other business incentives that reduce income or property tax revenues major or minor in terms of your budget? (36 responses)
- Major
- Minor
- Would loss of tangible personal property tax replacements have an impact on your school district? (52 responses)
- Major
- Minor
- Are there any other factors not covered here that have impacted the finances of your school district and that may impact the finances of others in a significant way? (18 responses)
(Are there any other factors not covered here that have impacted the finances of your school district and that may impact the finances of others in a significant way?)
| · Open Enrollment and Solvency Assistance Repayments eat up over 21% of our budget. Another 15% is spent strictly on special ed. This doesn't leave enough over to operate.· New budget proposal is devastating as we are highly dependent on the "guarantee"· We have already lost most of our TPP replacements. But it had a very large impact and was coupled with the 10% state funding cuts from a couple of years ago. We made staffing cuts to balance the budget and still have not been able to replace those staff members. Currently, we are still being affected by local tax losses due to valuation decreases and delinquent property taxes.· Affordable care act Cadillac tax will be a major issue in the future. Couldn't answer question 23. We still receive data and funding based on last years data.· The State says they give $5,750 to schools for each student they educate. When you divide the total State funding by the number of students we have it works out to $2,000 per student. This number even includes special education funding. Since we are considered a wealthy district we have a reduction factor for each student. Please help me understand why a student that lives right across from a school in our wealthy school district has the full $5,750 deducted from our funding and sent to the on-line school. The student still lives in a wealthy district. Why does he all of a sudden get the full amount of state dollars? If I only get $2,000 to educate this wealthy student why does the charter schools and community schools get the full $5,750. I don't mind if they take the $2,000 that I get for the student. Why do we get $2,000 and the charter and on-line schools get $5,750 for the same student. This practice is taking local tax dollars and giving it away to another school outside our taxing district. When the voting populations realizes that when they vote for their local school levy that some of that money will be sent outside their community they will stop passing a levy. Also, I would like to know why the State doesn't put some sort of factor in their school funding calculations that reflects the additional income taxes the wealthy are paying to the State. The funding now has a "capacity to pay" in the funding formula. They need to take into account the higher tax bracket a wealthy person is at. Yes, I agree that they have more money and they could afford to pay more in levies to a school but they are also paying a lot more money to the State in the form of income tax.· Reduction of Federal dollars for special education.· Fund schools based on what is right, now what you think they need based upon a bird's eye view from a state level that is far too removed from the local demographics, politics, classrooms, spending philosophies, etc.· We would lose $1.7M in TPP if it is phased out.· Inability to pass new operating levies. Have failed three in 1.5 years.· The inability to provide a sound forecast past the current biennium budget is a very poor way to conduct business, yet that is the way we must operate in public schools.· Jon Petersen and Autism Scholarships - the state does not reimburse the money going to the non public schools and an increasing amount of staff time is devoted to this process which is not reimbursed in any form by the State.· Decline in value of real estate from County reappraisal reduced our property tax revenue from previous years.· Cost of health care is a big challenge.· Purchasing of computers to meet student needs for PARCC assessments has been a major cost. Curriculum costs to meet Common Core standards have also been costly. · We do receive PILOTs but they are not "sufficient to replace revenues exempted" TPP reimbursement loss in excess of $14,000,000 ocurred a few years ago. Major cuts and hard freeze in salaries were in effect from 2010 to 2013 Your question regarding seeking local revenue does not indicate success or failure. · Funding levels for different types of schools should be addressed, political influence on straight A grants is embarrassing to all public school administration. · Our TPP reimbursements were previously eliminated, and it had a major impact on our budget. · Open enrollment
|
- There is no reserve. We could file bankruptcy if that were allowed.
- Yes, we have a minimum operating general fund cash balance policy of 45 days.
- No budget reserve policy yet, but we are working on it.
- Budget reserve policy of 60 days
- We have a $12M target annually on approximately $80 -$85 M budget
- No official budget reserve policy but we have a "practice" with multiple variables.
- No official policy. We have unofficial 90 true cash days.
- Budget reserve policy is 10% of budget
- Our policy is 90 days reserve
- Our reserve policy is 30 days operational cash
- Based upon 18 days of operating fund
- We have cut our way to a 3-month reserve balance and we want to maintain that health. The current budget proposal throws us into eating that balance in SY2017-2018 two years earlier than anticipated.
- Board and Administrative commitment to create a fund balance of three to six months of operating budget. It is not a Board policy, but a decision communicated by the Treasurer.
- Started a new reserve balance - never done previously
- Board felt this was hiding money from the public
- Reserve of 1% was spent in '11
- The reserve is dropping each year with expenditures growing faster than revenue.
- We made cuts and balanced our budget.
- Last half of levy cycle
- Reduction of Local taxes and increase demands to perform educationally.
- Increased school funding and cost saving reductions implemented from FY09-FY11
- Passed a levy that was 1/2 of what was needed and used cash balances to make up the difference. We got down to less than $1M this month and payroll is $2.5M/month. We had to beg for tax advances to cover payroll.
- Decrease in state funding
- Budget cuts
- We passed a levy in November 2013
- New income tax levy, effective Jan. 1, 2014
- Massive devaluation of property values, state level reductions (TPP/rollback), increases in charter/community school deductions.
- Constant review of the budget/staff turn over. Changes in health care (reductions), more efficient use of non-teaching staff and alternate salary schedules for new hires.
- No change in amount of reserve, but the percentage of operating budget has increased as our budget has decreased.
- Reduced staff, Increased State Foundation, Increased Open Enrollment revenue, passed a new levy in FY12.
- No changes. District has closely managed expenses to match available revenue. Reserves have been stable as a result.
- Paid out with severances.
- Additional staffing
- Additional levy passed
- none
- reductions made to address deficits leading to surplus
- Increased funding; reduction in expenditures
- Teacher hires primarily.
- STEM School - joint venture with ESC
- Blended learning
- STEM
- Technology
- Dual enrollment offerings
- One to one i-pads and other innovative classroom initiatives
- Technology in one of our elementary schools
- College Credit Plus and countywide STEM school.
- Consortium work to create textbooks written by teaching staff
- Technology
- Technology and at-risk programming
- Curriculum Alignment
- Battelle
- Teachers professional development
- Transportation
- Virtual academy
[2] Senate Bill 3 of 2003 changed the valuation of public utility property valuation and House Bill 66 of 2005 eliminated the tangible personal property tax on business personal property (machinery and equipment). Local governments and schools were promised tax reimbursements up to a certain point: the phase out of the replacements – or lack thereof – has been contested in budgets since then.
[3] Wendy Patton and Zach Schiller, Hard Times at City Hall, Policy Matters Ohio, January 2015 at http://www.policymattersohio.org/hard-times-jan2015
[4] Includes GRF, including federal stimulus dollars and lottery profits and tax reimbursements. See Howard Fleeter of the Educational Tax Policy Institute, cited in Patrick O’Donnell, “What Has Governor Kasich Really Done to School Funding in Ohio?” The Cleveland Plain Dealer at http://www.cleveland.com/metro/index.ssf/2015/03/what_has_gov_john_kasich_reall.html
[5] All fund budget figures for fiscal years 2008-09 through 2016-17 are taken from the Legislative Service Commission’s Budget in Detail. FY 2016-17 figures are from the budget in detail as enacted by the House.
[6] Innovation Ohio estimates that in the 2016-17 budget proposal, 408 local school districts (out of 609) get lower state funds than under the prior budget when estimated payments to charter schools are included. “The School Funding Freeze,” March 2015 at http://innovationohio.org/wp-content/uploads/2015/03/IO-Analysis-The-School-Funding-Squeeze-3-5-151.pdf
[7] According to the Ohio Department of Education, “Open Enrollment allows a student to attend school tuition-free in a district other than the district where his or her parents reside. Every spring, each school district in Ohio may choose whether nor not to accept students through open enrollment for the next school year.” For 2015-16, 520 districts will have some type of open enrollment policy, mostly open to students from any districts. See http://education.ohio.gov/Topics/School-Choice/Open-Enrollment
[8] “Solvency Assistance” is aid from the state when schools get into fiscal difficulties. “Open enrollment” refers to policies that allow students to enroll in neighboring schools and have state funding follows them. Federal special education dollars have dwindled.
[9] The “guarantee” in the state school funding formula is transitional aid to districts that are losing students established to help ‘smooth out’ their budgets. This is a $169 million program the current school year.
[10] According to the Ohio Department of Taxation, for property tax purposes, farmland devoted exclusively to commercial agriculture may be valued according to its current use rather than at its "highest and best" potential use. This provision of Ohio law is known as the Current Agricultural Use Value (CAUV) program. By permitting values to be set well below true market values, the CAUV normally results in a substantially lower tax bill for working farmers. (http://www.tax.ohio.gov/real_property/cauv.aspx).
[11] Analysis of school district reserves, California Legislative Analyst’s Office, January 21, 2015 at http://www.lao.ca.gov/reports/2015/edu/district-reserves/district-reserves-012115.aspx
[12] Stephen J. Gauthier, GFOA Updates Best Practice on Fund Balance, Government Finance Accounting Review, December 2009 at http://www.gfoa.org/sites/default/files/GFR_DEC_09_68.pdf. The State of Ohio’s rainy day fund can be no greater than 5 percent.
[13] Charlie Ross, “Kasich suggests schools use budget reserves to offset budget costs,” The Columbus Dispatch, February 15, 2015 at http://www.dispatch.com/content/stories/local/2015/02/15/too-much-savings.html (Accessed April 3, 2015).
[14] Wendy Patton, Economic impact of education cuts in the Kasich budget proposal: An input-output analysis , Policy Matters Ohio, April 11, 2011 at http://www.policymattersohio.org/wp-content/uploads/2011/10/BudgetBriefInputOutput2011_04.pdf
[15] Piet van Lier & Wendy Patton, “Survey Shows: Ohio Shrinks its Schools,” April 29, 2013 at http://www.policymattersohio.org/district-survey-apr2013 (accessed March 28, 2015).
[16] Matthew Ronfeldt , Susanna Loeb and Jim Wyckoff, “How teacher turnover affects student achievement,” reported in Stephen Sawchuk, “Teacher turnover affects all student achievement, study indicates,” Education Week, March 21 2014 at http://blogs.edweek.org/edweek/teacherbeat/2012/03/when_teachers_leave_schools_ov.html (Accessed 3/28/2015).
[17] Ronfeldt , Loeb and Wyckoff, Op.Cit.
[18] Matthew Richmond, “The hidden half: School employees who don’t teach,” Thomas B. Fordham Institute, August 2014 at http://edex.s3-us-west-2.amazonaws.com/publication/pdfs/Hidden-Half-School-Employees-Who-Dont-Teach-FINAL_0.pdf
[19] Bernard Michael, “Volunteers in Public Schools,” Committee on Volunteers in Public Schools, National Research Council, National Academy Press (Washington DC) 1990.
[20] PARCC stands for Partnership for the Assessment of Readiness for College and Careers. This is a group of states working together to develop a set of assessments that measure whether students are on track to be successful in college and careers. These computer-based K–12 assessments in Mathematics and Language Arts/Literacy are meant to give teachers, schools, students, and parents better information about whether students are on track, and tools to help teachers customize learning. In August 2010, Ohio became one of twelve states to win the Race to the Top competition. Ohio became a PAARC participating state in 2010 and helped shape PARCC’s proposal for a common, next-generation assessment system. It became a PARCC governing state in November 2011. See http://www.parcconline.org/ohio
[21] Howard T. Everson and Roger E. Millsap, “Everyone Gains: Extracurricular Activities in High School and Higher SAT® Scores,” College Board Research Report No. 2005-2 at https://research.collegeboard.org/sites/default/files/publications/2012/7/researchreport-2005-2-extracurricular-activities-high-school-higher-sat-scores.pdf (Accessed March 28, 2015).
[22] “Extracurricular Participation and Student Engagement,” National Center for Educational Statistics, June 1995 at http://nces.ed.gov/pubs95/web/95741.asp
[23] Ohio High School Athletic Association website at http://www.ohsaa.org/news/Magazine/Fall2014/Pg20.pdf
[24] Patrick O’Donnell, “School districts making budget guesses after governor's race offers few school funding clues,” The Cleveland Plain Dealer, http://www.cleveland.com/metro/index.ssf/2014/10/school_districts_making_budget.html
[25] Ohio Legislative Service Commission, “School Funding: An Overview of How Ohio Funds its Schools, presentation to House finance Committee February 18, 2015.
[26] Noah Berger and Peter Fisher, “A well-educated workforce is the key to state prosperity,” Economic Policy Institute, August 2013 at http://www.epi.org/publication/states-education-productivity-growth-foundations/
Tags
2015Budget PolicyEducation & TrainingRevenue & BudgetWendy PattonPhoto Gallery
1 of 22