What is statistical significance?
Posted on 10/03/14
When we say that something is “statistically significant,” we mean that it passed a “confidence test” of how well we can trust the results of a survey we’ve taken to paint a picture of the wider world. We need this test because we only have information about a small portion of the group we really want to know about. So the test tells us whether it makes sense to extrapolate that to the whole group.
When we use a statistical test, we are looking for a change in one group, like foreclosure rates in Ohio from year to year, or a difference in two groups, say the median hourly wage of union versus nonunion workers.
Significance testing is all about confidence
A significance test should report just how sure we are, with a “confidence level.” We might say that our results are “statistically significant at the 95% confidence level.” That means there’s a 95 percent chance that our results mean something, and a 5 percent chance we just got them by chance.
How do we know that?
Let’s take an example. Say we ended March with a 6.0% unemployment rate, and now at the end of April, we want to know if unemployment went up or down. We’re not going to ask everybody. We (actually, the Census Bureau) ask a group of people, and we find that the unemployment rate for them, our “sample” was 6.1%. So what we want to know is, did the unemployment rate really change? Or did we just happen to talk to a group with a slightly higher rate?
We test this using the “null hypothesis.” The null hypothesis always says “nothing changed,” “no news” “nothing to see here, folks.”
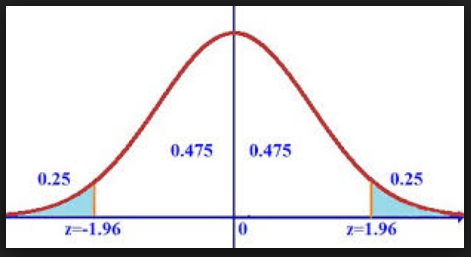
The question we ask is, “if nothing changes or there were no difference, how likely would we be to get the results we’re seeing?” The best way to show this is through a picture:
The zero in the middle shows no difference. It’s like saying, “the difference between last month’s unemployment rate and this month’s is zero”. But in our survey, we got a difference of not zero, but 0.1 percentage points. So the question is, “if the actual difference were really zero, how likely would we be to get a difference that big in our survey?” The white space under this bell curve shows that, assuming there really was no change, there’s a 47.5% chance we would get a difference that is bigger than zero, but smaller than some number. If our 0.1 percentage points falls in that region, then we would say that that’s what we expected to happen, assuming no real change.
In other words, our survey results show a change that isn’t exactly zero, but we’re chalking that up to sampling variance. We don’t have enough evidence to be confident that a real change took place, and our results are not “statistically significant.”
Survey data that indicate changes or differences but are reported as “not statistically significant” didn’t pass the test. That means the researcher didn’t find enough evidence to conclude that a real change took place, or a true difference existed.
But if our 0.1 percentage points falls in the blue area, then we know there’s just a 5% chance that would have happened if the unemployment rate hadn’t really changed. Conversely, we are 95% sure that it did. We can say that there was a “statistically significant” rise in the unemployment rate.
Judge for yourself
The decision whether something is “statistically significant” is a subjective one, since results can be significant at the 90% level, the 95%, 99%, or even the 99.9%. To judge for yourself whether information is significant, you need to know the confidence level that was used.[1]
When results are reported that seem to show a difference, but the results are reported as “not statistically significant,” it means the figures didn’t pass the test at the confidence level the researcher picked.
[1] There’s a trade-off involved in picking a confidence standard. If we pick too low a bar, say 90%, we increase our odds of accepting a “false positive” result, and making a mistake. But if we pick a very high bar, say 99.9%, we may be so skeptical that we dismiss something meaningful. Both 95% and 99% are widely accepted standards, and many studies will report both.

