Stuck: State of Working Ohio 2013
September 01, 2013
Stuck: State of Working Ohio 2013
September 01, 2013
Download report (21 pp)Download summary (2 pp)Press releaseLabor force participation in Ohio was at a 33-year low at the end of 2012, job growth since 2005 was fourth worst among states, and wages inched up just a penny from already-low levels. The State of Working Ohio 2013 finds a tough labor market in Ohio.
Executive summary
 The State of Working Ohio 2013 uses the best and most recent data available to understand how Ohio’s labor market is working. The unavoidable conclusion is that it’s not working well. Among the main findings this Labor Day:
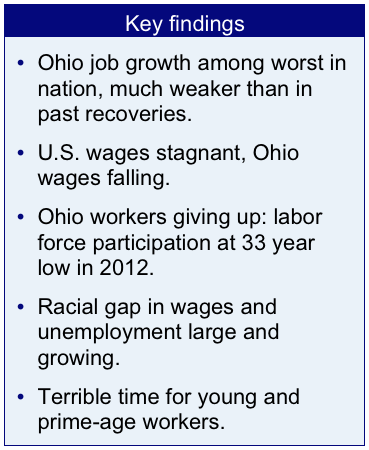
Weaker than previous recoveries: After the 1990 and 1981 recessions, Ohio fully recovered the lost jobs within about three and a half years or less, yet we haven’t recovered the jobs lost in either of the last two recessions more than five and 12 brutal years after the 2007 and 2001 recessions. In July 2012, Ohio had just 5.21 million jobs, down from 5.63 million at the peak in 2000.
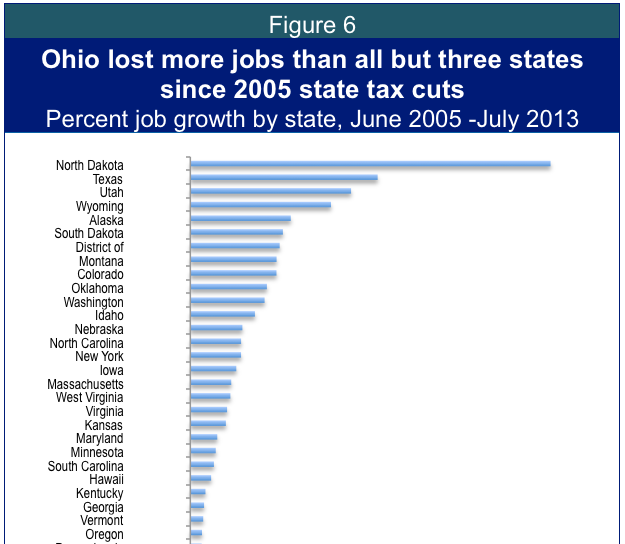
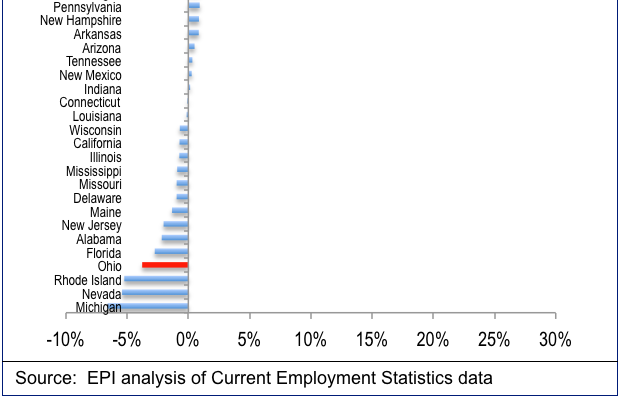
Worse job growth than the nation: While the national recovery is weak, Ohio’s is much worse. Since 2005 when tax cuts were passed here with the promise of job creation, Ohio lost more than 3.8 percent of its jobs while the nation’s grew by 1.8 percent. Only three states lost more jobs than Ohio since then. In all sectors, we lost more jobs and in the one sector that policy can control – public jobs – the country has added slightly while we’ve cut, further weakening a poor employment situation in Ohio. Our cutting of public jobs is in contrast to how we’ve behaved after previous recessions and is contributing to the weakness of this recovery.
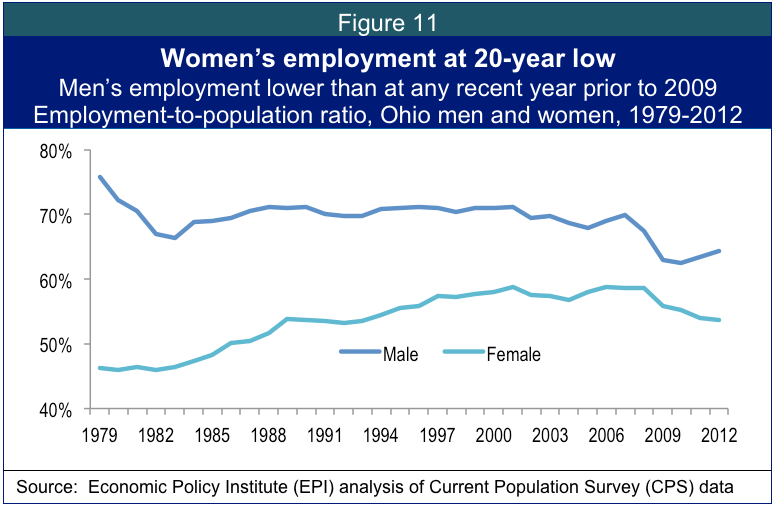
Historically low labor force participation: Labor force participation was at a 33-year low in 2012, lower than at any time since we’ve begun tracking it. The portion of adults who actually have a job is measured by the employment-to-population ratio, which inched above the dismal 2010 and 2011 rates, but was otherwise at a low not reached in the previous quarter century. Male labor force participation fell to an all-time low in 2012. Female labor force participation has fallen for four years straight, unprecedented since we’ve begun tracking it, and is now lower than at any time since 1995. The portion of adult women who were employed was at a twenty-year low at the end of 2012. For men, this proportion inched up in each of the last two years but finished 2012 lower than at any year prior to 2009, going back to when our data series begins in 1979. With the exception of the last few dismal years, we have to go back to 1985 to find a worse year for African American employment-to-population ratios.
Productivity is growing, compensation is not: Nationally, productivity grew more than 27 percent between the first quarter of 2000 and the second quarter of 2013, while average compensation, including benefits, grew just 6.5 percent.
Ohio’s low-wage trap: Ohio’s median wage – the wage earned by a worker precisely in the middle – nudged up by a paltry two cents between 2011 and 2012 and remains, with the exception of last year, lower than it has been since 1996 adjusted for inflation. Wages were higher for Ohio median workers in 1979 and also in much of the 80s, late 90s and 2000s. National analysts are lamenting the “lost decade” – in Ohio we’ve had a decade and a generation of not just stagnation but wage decline. Ohio’s median wage now lags nearly 75 cents behind that of the US as a whole, in contrast to a generation ago when Ohio workers earned more than $1.50 more per hour than US workers.
Disparities endure: Women earned $3 less per hour than men in Ohio in 2012 and the black-white wage gap in Ohio has grown to more than $3.50 an hour. Black Ohio workers earned more than 60 cents less ($13.02) than black American workers at the mid-point ($13.64) in 2012. At 14.6 percent, unemployment in the black community is more than twice as high as in the white community.
Tough times for young and prime-age workers: We have to go back to 1985 to find a year when a smaller portion of prime-age workers (those between the ages of 25 and 54) was in the Ohio labor force. Young people in Ohio face recessionary levels of unemployment at a time when they should be climbing the first rungs of a career ladder. Nearly 13 percent of workers between ages 16 and 24 are looking for and unable to find jobs in Ohio.
 Long-term unemployment persists: By the end of 2012, more than one in three of those without jobs had been out of work for more than six months. Prior to this recession, 1983 was the only year when the long-term unemployment share was this high. By late 2012, it had been this high for three years in a row.
While some indicators are slightly better than they were in last year’s report, Ohio’s economy does not look like it should in a real recovery. The title says it all – we are stuck in Ohio. Stuck in the aftermath of a terribly deep recession, stuck in a weak recovery, stuck with shrinking wages, stuck with growing disparities. The national economy is weak and ours is worse. The austerity policies passed in 2005 and continued with little interruption since are not working in Ohio. It’s time for something new. We end by recommending that Ohio:
- Invest in education, from cradle to retirement. States that are increasing their educational investments are also doing a better job of increasing their wages.
- Retrofit Ohio for the new energy economy. Doing so will create jobs now, save money later, and reduce climate change.
- Restore public jobs. This smart countercyclical move will boost the economy and improve public services, positioning our families and communities better for the future.
These three changes will put Ohioans back to work and get our state out in front of the demands of a changing economy. It’s time for Ohio to again lead the way.
Introduction
Ohio is stuck: stuck with little job growth, declining wages, and enduring disparities. While some indicators have inched up since last year, this does not look like a state of recovery. In a slow-growing national economy with weak job quality, we are faring worse. Stuck: The State of Working Ohio 2013 uses the best and most recent data available to understand how Ohio’s labor market is working. The unavoidable conclusion is that it’s not working well. We end with concrete recommendations to create more and better jobs for people who work or want to work in Ohio.
Where are the jobs?
Ohio’s recent job growth has been weak by historical standards and dismal in comparison with other states. We never recovered from the 2001 recession and recovery from this recession appears to have stalled after a brief rally in late 2010 and early 2011. In July 2012, Ohio had just 5.21 million jobs, down from 5.63 million at the peak in 2000 as Figure 1 shows. (Final data point is monthly, others annual.)
Ohio’s economy has been weaker than the nation’s for some time, with brief exceptions. As Figure 2 shows, we failed to gain jobs during the late 2000s when the national economy was doing better and we lost a greater portion of our jobs during the 2007 recession. There was a period in 2010 and 2011 when our growth was briefly stronger than that of the nation, but more recently while the national recovery inched forward, we’ve stalled. We start much of our analysis in 2005, when tax cuts were passed in Ohio on the theory that they would lead to greater job growth. Since that period, Ohio’s job and wage growth have lagged the nation dramatically.
Since the 2005 tax cuts in Ohio, our state has lost more than 3.8 percent of its jobs in total while the nation’s jobs have grown by 1.8 percent as Figure 3 shows.
One way to understand the weakness of Ohio’s recovery from the 2007 recession is to compare it to the aftermath of other recent recessions. By this standard, both the 2001 recovery and the current recovery have been troubled. After the 1990 recession, Ohio fully recovered the lost jobs within just under three years (35 months) and after the 1981 recession, all jobs were recovered within about three and a half years (44 months). In contrast we still haven’t recovered the jobs lost in either of the last two recessions, more than five years after the 2007 recession began and a brutal 12 years after the 2001 recession. Figure 4 sets the pre-recession job count at 1 and the horizontal access starts three months before each recession’s official beginning.
In the one sector that policy can really control – public jobs – the country as a whole has added slightly (.04 percent) while Ohio has cut (-6.4 percent), further weakening a poor employment situation. After the 1981 and 1990 recessions, Ohio added public jobs, providing a counter-cyclical boost to the economy and also providing more of the services that families need when they are struggling financially. After the 2001 recession, public job growth was flat and the recovery was weak. And after the 2007 recession we cut public jobs sharply and recovery has been anemic as Figure 5 shows. By the beginning of 2013, there were fewer than 513,000 public sector jobs in Ohio. This meant not only that the displaced teachers, firefighters, social workers and bus drivers were unavailable to deliver valuable public services to Ohioans but it meant that our overall economy was weaker.
Ranking Ohio among states, as Figure 6 does, provides a grimmer picture – only three states have lost more jobs than Ohio has since 2005 when tax cuts were passed here with the promise that they would revive job creation. The strongest job creation has been in states experiencing big natural resource booms (Texas, North Dakota and Wyoming), something that’s difficult to control. States do have influence over education levels however, and a recent study demonstrated that productivity and compensation are much higher in states with higher levels of education.[1]
Figure 7, below, shows that there is no sector in which Ohio added a higher portion of jobs than the rest of the country between 2005and July 2013, the most recent data available. We’ve added jobs in mining, education and health, leisure and professional business services, but in each case we’ve added a smaller percentage of jobs than the nation as a whole has. Despite the Ohio legislature’s refusal to enact a severance tax, we’ve added a smaller percentage of mining jobs than the nation as a whole. In all other sectors we’ve lost jobs and in all cases we’ve lost more jobs than the country has. Note that this chart looks at percent growth, not absolute numbers; the pie chart that follows makes clear that the fastest-growing areas are not necessarily the larger parts of our economy.
 While mining positions may be growing more than other sectors, they remain a sliver of the Ohio economy. Most jobs are in the sectors of trade, transportation and utilities; education and health; manufacturing; the public sector and professional business services as Figure 8 shows.
Where are the workers? Leaving the labor force
Labor force participation and overall employment remained extremely weak in 2012. Labor force participation was at a 33-year low, lower than at any time since officials have begun tracking it. While labor force participation rose a bit in early 2013 (not shown on chart), it has since fallen again. The portion of adults who actually have a job is measured by the employment-to-population ratio, which inched above the dismal 2010 and 2011 rates in 2012, but was otherwise at a low not reached in the previous quarter century, as Figure 9 shows. Labor force participation was 63.4 percent in 2012, and the employment-to-population ration was 58.8 percent. While the unemployment rate, which we discuss later in the paper, gets more attention, these important labor market indicators are less well-understood. But they matter because when jobs are scarce, workers drop out of the labor market and are no longer included in the unemployment rate. Knowing how many people are working and how many have stopped trying to find jobs tells us a lot about the health of the labor market. By these measures, Ohio’s labor market is struggling.
Men and women both left the labor force in 2012. Male labor force participation in Ohio has dropped in many individual years over recent decades but fell to an all-time low in 2012 as Figure 10 shows. Only in the post-2007 recession has female labor force participation in Ohio dropped so sharply. This is a glaring sign that more jobs are needed in Ohio.
Figure 10 above shows that fewer men and women are in the labor force. Figure 11 below shows that fewer women are also working – the portion of adult women who were employed was at a twenty-year low at the end of 2012. For men, this proportion inched up in each of the last two years but finished 2012 lower than at any year prior to 2009 going back to when our data series begins in 1979.
African-American employment-to-population ratios have falling precipitously since 2001 in Ohio, declining in all years except 2005 and 2006, and actually falling below 50 percent in 2011. Black employment ratios crept up in 2012 by a little over a percentage point as Figure 12 below shows, hardly a sign of a strong labor market, but better than the declines that have occurred for more than a decade. Still, with the exception of the last few dismal years, we have to go back to 1985 to find a worse year for African American employment levels.
Wages: Low, unequal and falling
It is easy to conclude from the dismal news about the weak recovery that nothing is working in the economy. That would be a false conclusion. American productivity is strong and growing. What is not growing is the availability of good jobs at good wages. Figure 13 shows that productivity has grown substantially since the year 2000 at the national level. This chart uses average hourly compensation, so it includes growth in benefits. It measures the average worker, not the middle worker, and is therefore skewed upward by the highest earners. Even by this conservative measure, income is stagnating as productivity grows steadily. Over the entire period examined, the first quarter of 2000 through the second quarter of 2013, productivity grew by more than 27 percent while compensation grew by less than 6.5 percent. Between 2003 and the end of 2012, compensation has not grown at all – a lost decade nationally. Overall compensation remains below the level in the third-quarter of 2004.
Inequality is difficult to measure at the state level because the vast majority of American inequality occurs within the top ten percent where accurate recent state data is hard to obtain. We do know that inequality is worse at the national level than it is in Ohio alone. Figure 14, using national data, helps us understand the depth and growth of inequality in America. The top one percent of Americans owned more than one third of American wealth in 2010 while the bottom 90 percent of people shared less than a quarter of the nation’s net worth.
Income inequality is also extreme and growing in America. The top five percent of American households earned $147,000 more in 2011 than such families had earned in 1979, while the poorest fifth of families actually earned less in that final year, and the middle fifth experienced just a $4,500 income gain, adjusted for inflation. By 2011, families in that top five percent earned more than six times more than those in the middle and more than 23 times more than those in the bottom 20 percent. The growth in our economy goes mostly to the top. These national trends are shown in Figure 15.
State data on earnings at different percentiles, in Figure 16, shows that Ohio has become much less equal in the past generation, that most Ohioans are doing worse than a similar cohort about thirty years ago, and that all of the growth in well-being has gone to the top. The bottom 70 percent of Ohio workers have seen their wages decline, adjusted for inflation, in comparison to workers at a similar point on the earnings spectrum in 1979. The only groups that have seen any real wage growth are at the 80th and 90th percentiles – those workers who already earn more than 80 or 90 percent of workers in the state. Middle-income workers have done particularly poorly over the past generation, seeing their real wages shrink by more than a dollar an hour compared to similarly situated workers in 1979.
Ohio’s real median wage – the wage earned by a worker precisely in the middle – nudged up by a paltry two cents between 2011 and 2012 and remains, with the exception of last year, lower than it has been since 1996. While corporate profits have rebounded nationally, for workers directly in the middle in Ohio, compensation remains low and stagnant. Wages were higher for Ohio median workers in 1979 and also in much of the 80s, late 90s and 2000s when adjusted for inflation as Figure 17 shows. National analysts are lamenting the “lost decade” for wage growth nationally over the past ten years. In Ohio, we could only wish that wages were what they were a decade ago at the median ($16.62) – here they’ve fallen by over a dollar an hour in that time.
Ohio’s median wage now lags nearly 75 cents behind that of the US as a whole, though both the US and Ohio median wages, shown in Figure 18, have shrunk or stagnated in recent years. A generation ago Ohio workers earned more than $1.50 more per hour than U.S. workers, when adjusted for inflation. Education has become more important to wage growth in the past generation and, although Ohio workers are much more educated than in the past, education levels have not grown as quickly as in higher-wage states.
Women earned three dollars less per hour than men in Ohio in 2012, despite the fact that men’s wages have fallen by more than three dollars an hour since 1979 in inflation-adjusted terms. Women’s wages at the mid-point have risen by about two dollars an hour since 1979 but still lag behind those of men at the mid-point, as Figure 19 shows.
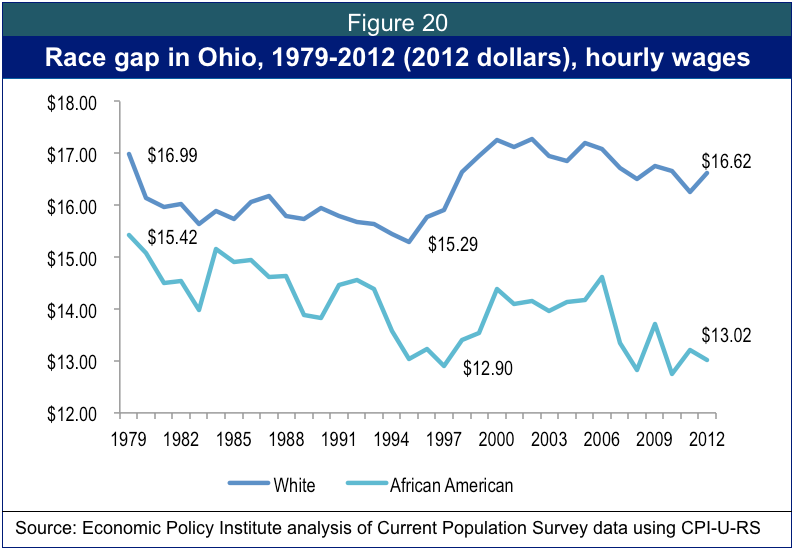
While black workers in Ohio earned considerably more than black workers in the country as a whole in 1979 (seen in Figure 20), that is no longer the case. Ohio African-American workers earned more than 60 cents less ($13.02) than black American workers at the mid-point ($13.64) in 2012. Black workers have seen a sharp drop in job quality over the past generation in Ohio with wages of black workers dropping from $15.42 in 1979 (inflation adjusted) to just $13.02 in 2012. White worker wages have also fallen, but less steeply and from a higher starting point: white workers earned $16.62 at the median in 2012.
Age and education: tough time to be young
One sign of our persistently poor economy is the degree to which even prime-age workers, between the ages of 25 and 54, are leaving the labor force or are not employed. We have to go back to 1985, a time when many fewer women worked, to find a year with comparably low labor force participation rates for prime age workers. Though employment-to-population ratios for these workers inched up slightly in 2012, they remain lower than in most of the last quarter-century with the exception of the last three years, as Figure 21 shows.
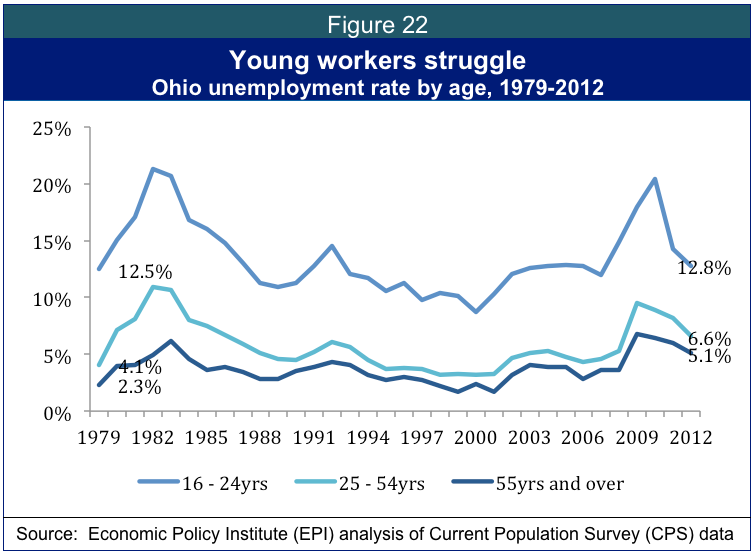
While the situation is grim for prime-age workers, it is worse still for young people. The terrible recession and the glacial recovery have made the last five years a difficult time to be starting out in the labor market. Consequently, young people in Ohio face recessionary levels of unemployment at a time when they should be climbing the first rungs of a career ladder. Nearly 13 percent of workers between ages 16 and 24 are looking for and unable to find jobs in Ohio. This does not include full-time students who aren’t seeking employment; as always, the unemployment rate measures the rate for those actively seeking work. The situation for our next generation of workers is not quite as dismal as it was at the height of the weak economy, as Figure 22 shows, but it remains an unwelcoming labor market for newcomers.
Ohio workers with less education have the least chance of finding and keeping decent jobs in this economy – those without a high school degree have unemployment levels above 16 percent, meaning nearly one in six is actively seeking and unable to find work as Figure 23 shows. The rates have fallen slightly in each of the last two years but remain at levels typical of recession, not recovery.
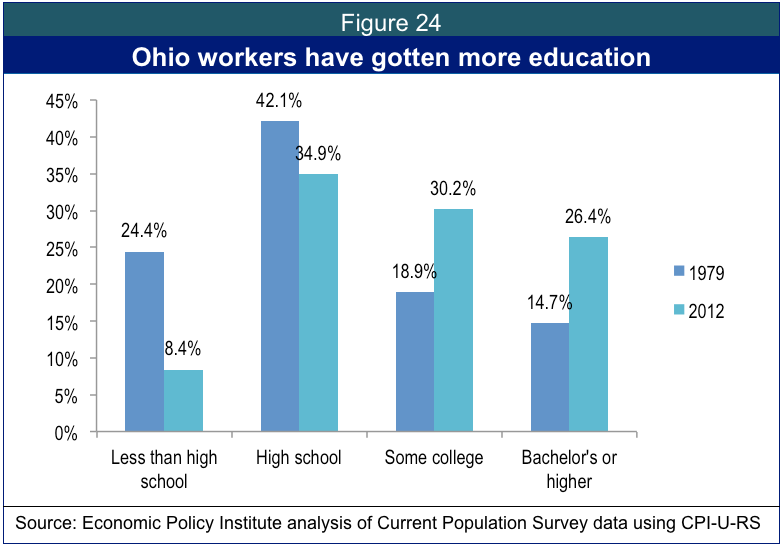
Ohio workers were 80 percent more likely to have a bachelor’s degree in 2012 than they were in 1979, but still only a little more than a quarter of Ohio adults have that level of education. Workers are also much more likely to have some college, a category that includes both those who have gotten associate’s degrees and those who have started but not finished a four-year degree. Now more than 56 percent of Ohio adults have either some college or a college degree, up from just 33 percent in 1979 shown in Figure 24. The vast majority of Ohio adults now have at least a high school degree – more than 90 percent of Ohio adults have completed high school, up from just over 75 percent in 1979. Despite this growth, Ohio levels of higher education lag behind those of most other states. Investing in higher education makes sense, as wages for those with anything less than a college degree have fallen sharply in the last few decades. The median worker with at least a BA earned $24.13 an hour in 2012, well over two and a half times the hourly wage of someone with less than a high school degree, which was just $9.15 an hour in 2012.
Unemployment: persistent and hitting some groups harder
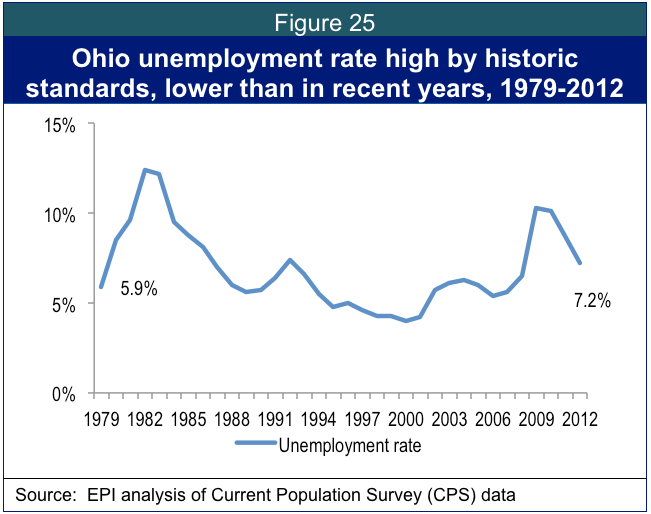
The unemployment rate measures people who are actively seeking work and unable to find it. It is an estimate of the number of people who are in the labor force and not finding work. It gets more attention than other indicators, and it is important, but it can be more complicated than it initially seems. It leaves out those who have stopped looking for work, and those who are working part-time but would rather be full-time. Thus, many out-of-work people are not part of the rate. Sometimes when the labor market improves, workers rejoin the labor force, paradoxically driving the unemployment rate up. Similarly, after prolonged periods of high unemployment, like we are experiencing now in Ohio, workers get discouraged, stop seeking work, leave the labor market and drop out of the statistic. Overall annual unemployment levels in Ohio remained at 7.2 percent in 2012 nearly five years after the start of the last recession as Figure 25 shows. The July monthly unemployment rate in Ohio, after some fluctuations in the months in between, was also at 7.2 percent. Men lost more jobs early in the recession, but male and female unemployment rates converged by the end of 2012 at a troubling above-7-percent level, down from the peaks at the height of the recession, but still nowhere near what recovery-level rates should be. Ohio’s unemployment rate had been lower than the nation’s for much of the last three years but the most recent release from the Bureau of Labor Statistics indicated that the current difference between the Ohio and national unemployment rate is not statistically significant.
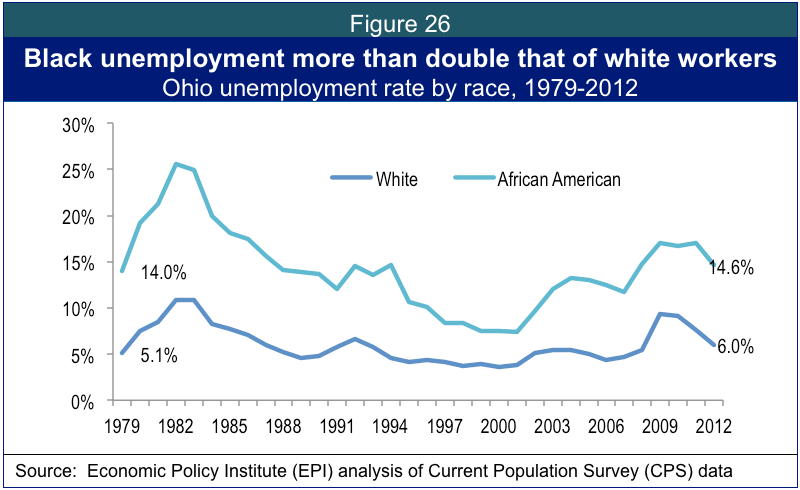
For African-American workers, unemployment remains above a level that would be considered recessionary if it were affecting the state as a whole. At 14.6 percent, unemployment in the black community is more than twice as high as in the white community. More than one in seven black workers in Ohio is actively looking for and unable to find a job as Figure 26 shows.
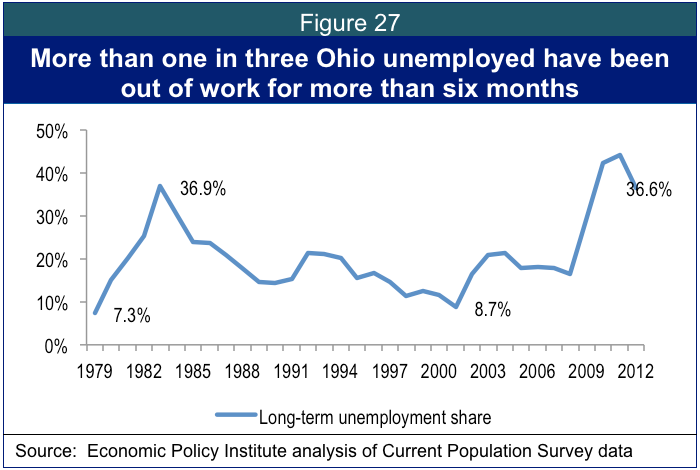
Among the worst features of the 2007 recession and its slow recovery has been the length of spells of unemployment – those who lost jobs during the recession often failed to find new jobs even after many months of looking. By the end of 2012, more than one in three Ohioans without jobs had been out of work for more than six months, which is extremely high by historic standards. Prior to this recession, 1983 was the only year when the long-term unemployment share was this high. By late 2012, it had been this high for three years in a row, as seen in Figure 27.
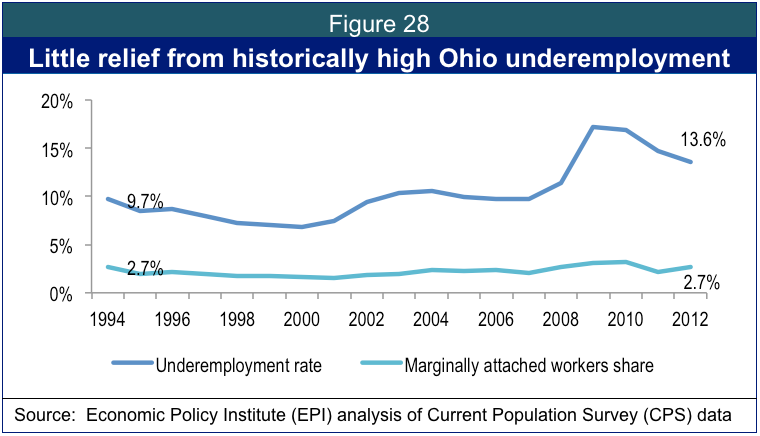
Unemployment is the worst situation to face workers, particularly long-term unemployment. But in a weak labor market many workers accept part-time jobs when they’d rather work full-time, stop looking because they don’t think they’ll find a job, or stop looking because they lack the child care or transportation that they would need to be able to work. Beginning in 1994, the federal government began adding these variables together in a measure it calls “underemployment”, shown in Figure 28. Underemployment fell between 2011 and 2012 in Ohio, but since 2009 has remained above the level of any year measured prior to that. The marginally attached line shows the workers who have stopped looking for work but do want work and are available for it.
Conclusion: Time for a change
The title says it all – we are stuck in Ohio. Stuck in the aftermath of a terribly deep recession, stuck in a weak recovery, stuck with shrinking wages, stuck with growing disparities. While some indicators have improved slightly from the worst lows of recent years, the statistics do not reflect a state of recovery. The national economy is weak and ours is worse. The austerity policies, passed in 2005 and continued with little interruption since, are not working in Ohio. It’s time for something new. We recommend that lawmakers:
I. Invest in education, from cradle to retirement. States that are increasing their educational investments are also doing a better job of increasing their wages. In early care, preschool, K-12, community college, four-year universities, and worker retraining, there are best practices to which Ohio can rise. And in some cases, such as the Employment Connection program in Cleveland, Ohio is setting the standard. We should better fund childcare, fully fund the Ohio College Opportunity Grant and make it easier for community college students to access, restore state funding to K-12 education, and do more to make tuition affordable.
II. Retrofit Ohio for the new energy economy. Ohio invests less in mass transit and wastes more on energy than most other states. This means that valuable energy dollars leave our state and that we are worsening our warming planet, leaving us all more vulnerable to crazy climate change. But it also means that we have an opportunity to employ entry-level and skilled workers modernizing our grid; insulating our buildings; greening our manufacturing sector; making, installing and maintaining solar panels and wind turbines; driving and maybe even building transit vehicles and next generation cars; building bike lanes; and more. Some concrete steps that would help: keep and strengthen our clean energy standards, restore our advanced energy fund, craft innovative ways to meet the new federal climate regulations, help local communities develop sustainably, and fund mass transit.
III. Restore public jobs. A glaring flaw in our handling of the aftermath of this recession is that we’ve gutted public jobs. In doing so, we’ve worsened the economy, lengthened the unemployment lines, and robbed Ohio stores, restaurants and service providers of customers. In more successful recoveries, we’ve added public sector workers, providing a smart countercyclical boost to the economy, getting projects done at a time when a slump made that cheaper to do, and ensuring that the social workers and others who help us through tough times are able to deliver for Ohio. Restoring cuts to schools and local governments would get our public workers back on the job.
These three changes will put Ohioans back to work, get our state out in front of the demands of a changing economy, and position Ohio for future success.
Acknowledgements
For substantial assistance with data and charts, we thank Shubo Yin, Lauren Klingshirn, Zane Eisen and Hannah Halbert at Policy Matters, David Cooper and Heidi Shierholz at the Economic Policy Institute, and Colin Gordon at the University of Iowa.
[1] Berger, Noah and Peter Fisher. “Education Investment is Key to State Prosperity,” Economic Analysis and Research Network, August 2013. Available at www.policymattersohio.org/education-aug2013.
Tags
2013Amy HanauerState of Working OhioWork & WagesPhoto Gallery
1 of 22


