Hard times at city halls: Localities struggle with damaged tax base, state cuts
January 07, 2015
Hard times at city halls: Localities struggle with damaged tax base, state cuts
January 07, 2015
By Wendy Patton and Zach Schiller
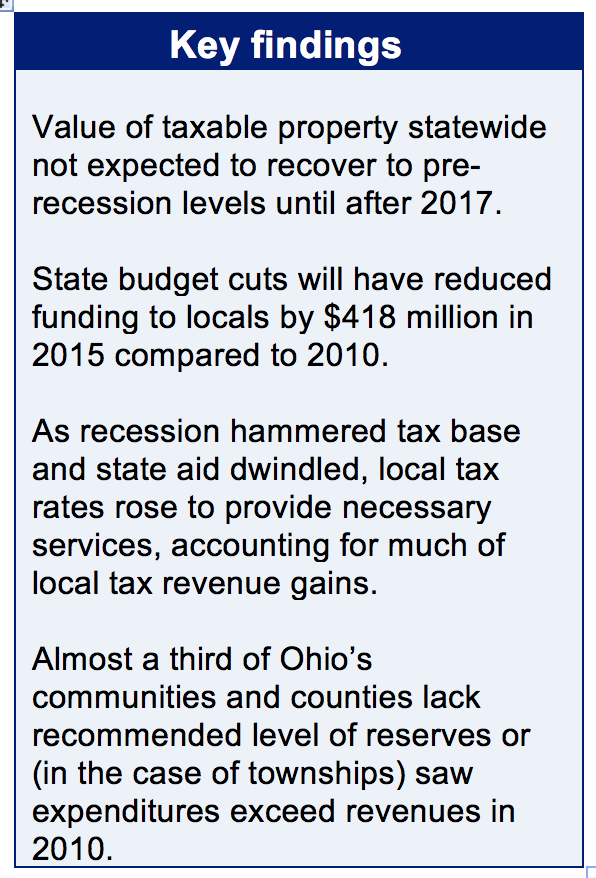 Many Ohio communities have not recovered from the recession. State funding cuts have worsened the situation. Localities employ 41,100 fewer people than they did in November 2007. Almost a third of Ohio communities and counties have reserves below recommended levels. An even larger share of townships, which are not required to report reserves, saw expenditures exceed revenues in 2012. Many towns and cities have increased local taxes to try to compensate for state funding cuts and lagging tax bases.
Ohio is more dependent on local government public services than most states. For example, Ohio ranks last in state funding for children’s services, and first in local financing of these services.[1] The situation is similar in services for those with developmental disabilities.[2] The state provided flexible funding to local government, dating back to the establishment of the Local Government Fund in the 1930’s. Even before that, inheritance tax revenues were shared. The state is dismantling this fiscal partnership: it cut Local Government Funds, eliminated most tax replacements and did away with the estate tax and the property tax rollback for levies that raise new funds.
The impact of state cuts varies from place to place, but no county or community has been untouched. The mayor of Cincinnati estimates loss of state funding and estate tax revenues have cost the city $29 million a year.[3] Cleveland lost $35.5 million a year.[4] Dayton has lost $20 million since 2011 and as a result, has fallen behind in resurfacing streets, replacing police cruisers and garbage trucks, and demolishing vacant and abandoned buildings.[5] The village of Orwell, in Ashtabula County, remains 35 percent below 2008 revenue levels and has struggled to provide adequate police and fire services.[6] These are just four jurisdictions among the thousands that lost state aid. The dilemma is the same in all corners of the state.State of Ohio factsheets and forecasts
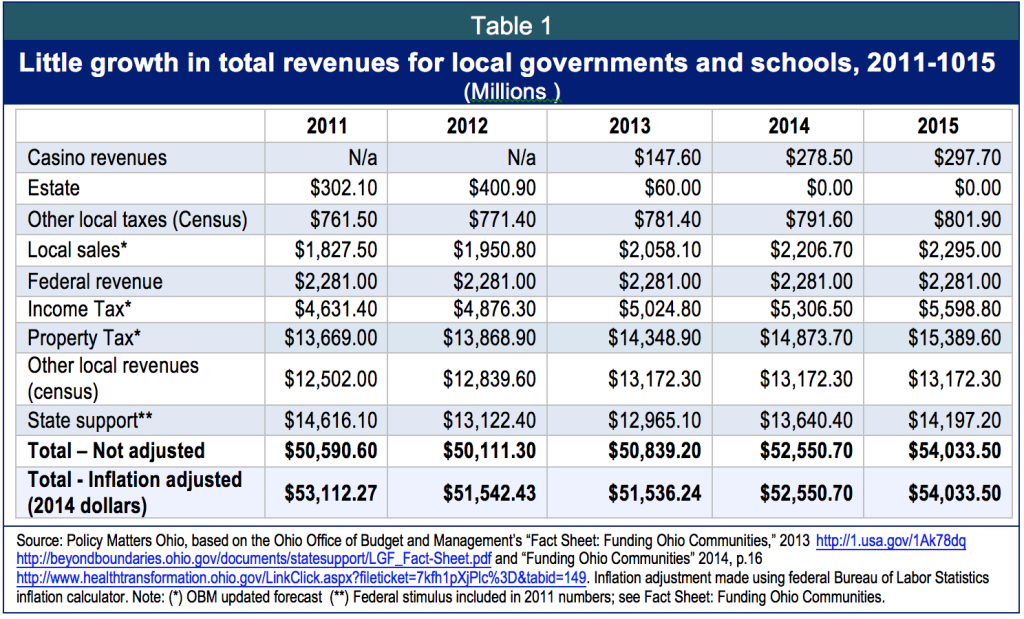
Ohio’s Office of Budget and Management (OBM) show scant growth in its tally of total federal, state and local revenues for schools and local government funding sources.[7] When adjusted for inflation, OBM factsheets on funding local communities, updated with forecasts from this past fall, reveal that total local government revenues fell in calendar years 2012, 2013 and 2014 compared with the base year of 2011, and rose by 1.7 percent in 2015 (Table 1, inflation adjusted).
The OBM factsheets overstate funding available for basic local government operations by including federal census data. The census data, and in particular the category “Other Local Revenues,” amounting to $13.6 billion in calendar 2014, includes things like payments for operation of water and sewer systems, airport landing fees and money paid by students for school lunches. A community cannot make up for state budget cuts with sewer fees. Nor do airport landing or school lunch fees make up for loss in municipal general funds.In 2013, Policy Matters testified on this to a legislative committee. “It is worth noting that when baseball fans go to watch the Toledo Mud Hens, the Census Bureau and OBM consider the money they spend buying tickets local government revenue,” Research Director Zach Schiller told the committee, referring to the numbers shown in Table 1, above. “Lucas County includes the nonprofit corporation that owns the team in its financial statements, treating it as a ‘component unit’ much like the county land bank and its convention and visitors bureau. This highlights the fact that the OBM data on local-government revenues – aimed at showing that cuts in aid are insubstantial – do not show the reality that local governments face.” [8]
Local revenue
Tax rate increases have played an important role in maintaining funds for local public services since the recession. This section reviews changes in the major local tax revenue sources since 2007. Data presented here show statewide outcomes: Individual communities,of course, fared better or worse than the average.
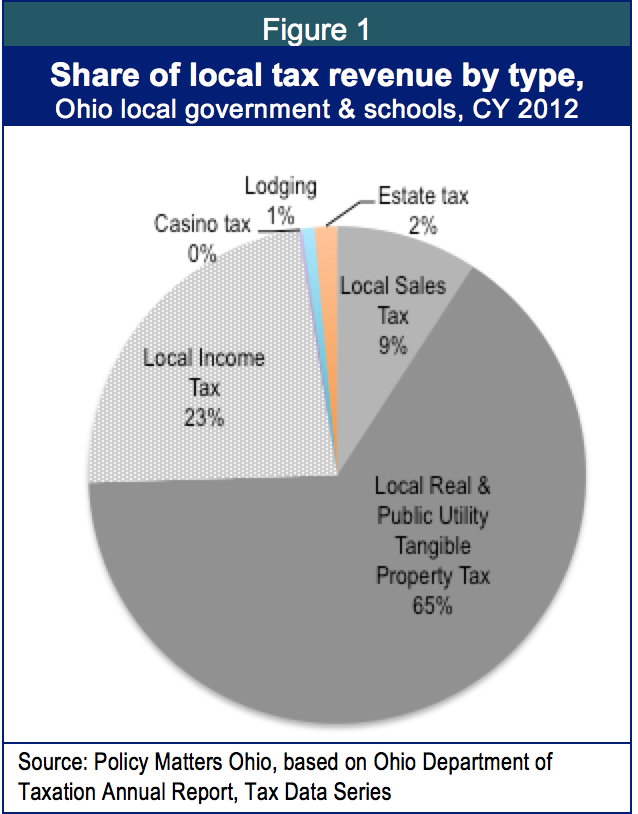
Property, income and sales taxes provide the vast majority of funding for what is typically considered basic local services, such as police, garbage collection and K-12 education (Figure 1). A few other local tax sources – lodging and admissions, casino revenues - provide a small share of funding. Figure 1 shows configuration in 2012, because the Department of Taxation has estimates for all taxes in 2012. The estate tax has been eliminated and will disappear, and casino revenues will grow. However, these are minor taxes. The big three are local property, sales and income taxes.
The property taxThe property tax is the backbone of local public finance in Ohio. The largest distribution, 63 percent, went to Ohio’s primary and secondary schools in 2013. Another 2 percent funded joint vocational schools. The remainder was distributed to counties, municipalities, townships and special districts.[9]
Any county, township, city, village, school district or other special district can levy property taxes. Ohio’s property tax system iscomplex and several mechanisms are at work, but generally speaking, as property valuations fall, tax rates on some levies rise to about the same percentages as voted, or as valuations on existing property rise, rates on some levies fall. Counties reassess the value of local property once every six years and update property values every third year. The Ohio Department of Taxation calculates effective tax rates annually based on a system of tax reduction factors.[10]
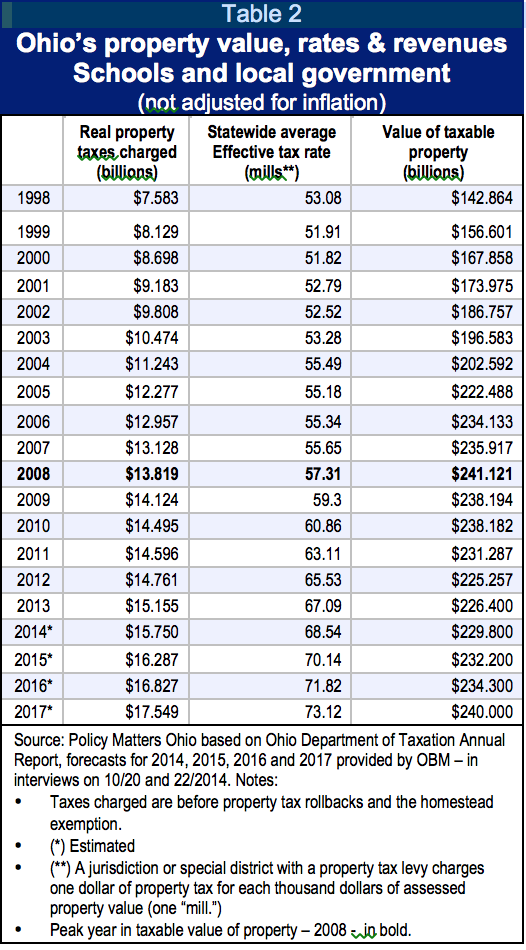
Table 2 shows two decades of Ohio’s taxable property values, effective tax rate (in mills) and tax revenues (not including property tax relief). This includes both schools and local governments.
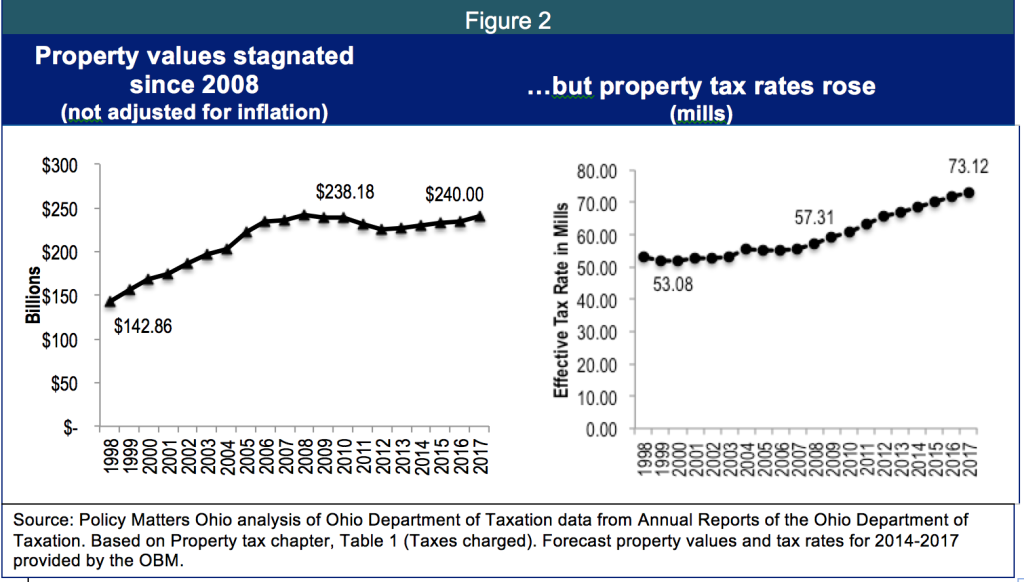
Property tax revenues grew as the economy expanded before the recession. New homes and commercial properties were built and taxes paid on the expanded development. With the recession, growth in property tax revenue flattened. As values fell, effective tax rates rose. Values won’t quite rebound to 2008 levels even by 2017, according to OBM estimates, while rates are projected to increase, based on the historical trend.[11] Figure 2 illustrates the trend in property values and tax rates.
Between 1998 and 2007, the value of taxable property rose by an average growth rate of 5.8 percent every year. The statewide average effective tax rate (expressed in mills)[12] grew very slowly, by an average annual rate of just .5 percent. Property taxes charged grew by 6.3 percent, an increase that paralleled growth in property values.
Growth in the value of taxable property is expected to be close to flat during the decade of 2008 to 2017, actually falling slightly by .04 percent a year, on average (not adjusted for inflation). The effective property tax rate is projected to grow by an average yearly rate of 2.8 percent during this time. Property tax revenues will grow at 2.7 percent. In this decade, the projected growth in revenue will be largely due to increases in tax rates, rather than property values (Table 3).
Some, but not all, of the change in tax rates over these two decades is due to the adjustment mechanism of the tax system. For example, in 1999, the value of taxable property statewide increased by 9.6 percent over 1998. Tax rates fell but tax revenues[13] rose, buoyed by development of new homes and commercial property.This pattern changed with the recession. In 2008, the taxable value of property statewide was $241.1 billion and the effective tax rate was 59.1 mills. In 2017, the taxable value of property is projected to be $240 billion – about the same as in 2008 - but the estimated tax rate will be 73.12 mills.[14] During the slow recovery, growth in property tax revenue has been due mostly to rising tax rates, since property values on a statewide basis have not rebounded.
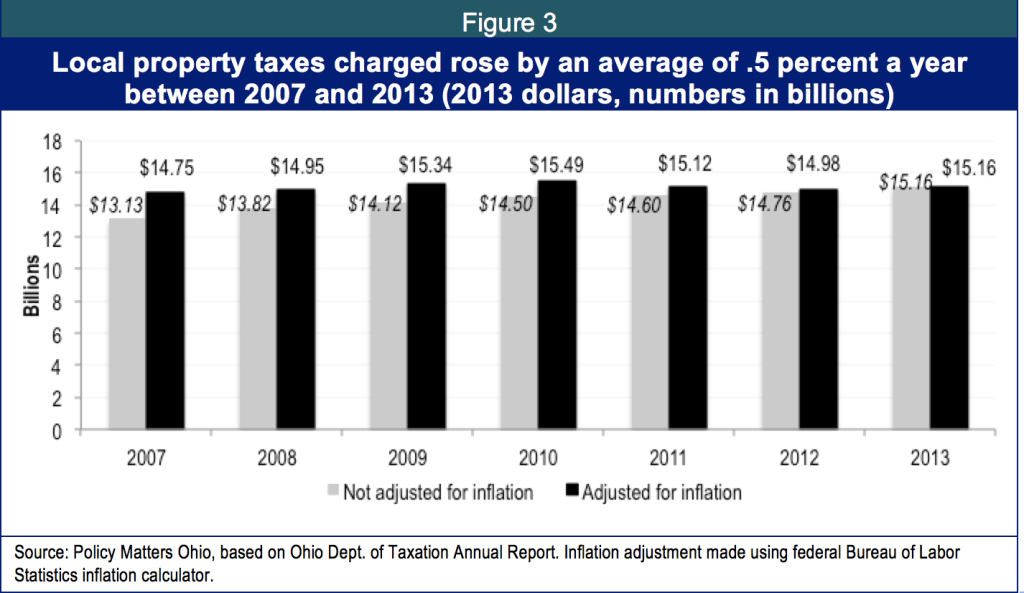
By 2013, statewide, Ohio communities were charging $15.16 billion in property taxes, up from $14.75 billion in 2007, adjusted for inflation. Between 2007 and 2013, the average yearly rate of growth in property taxes charged was .5 percent in inflation-adjusted 2013 dollars (Figure 3). OBM forecasts growth (in current dollars) of 3.7 percent in 2014 and 3.4 percent in 2015.[15]
Local income taxes
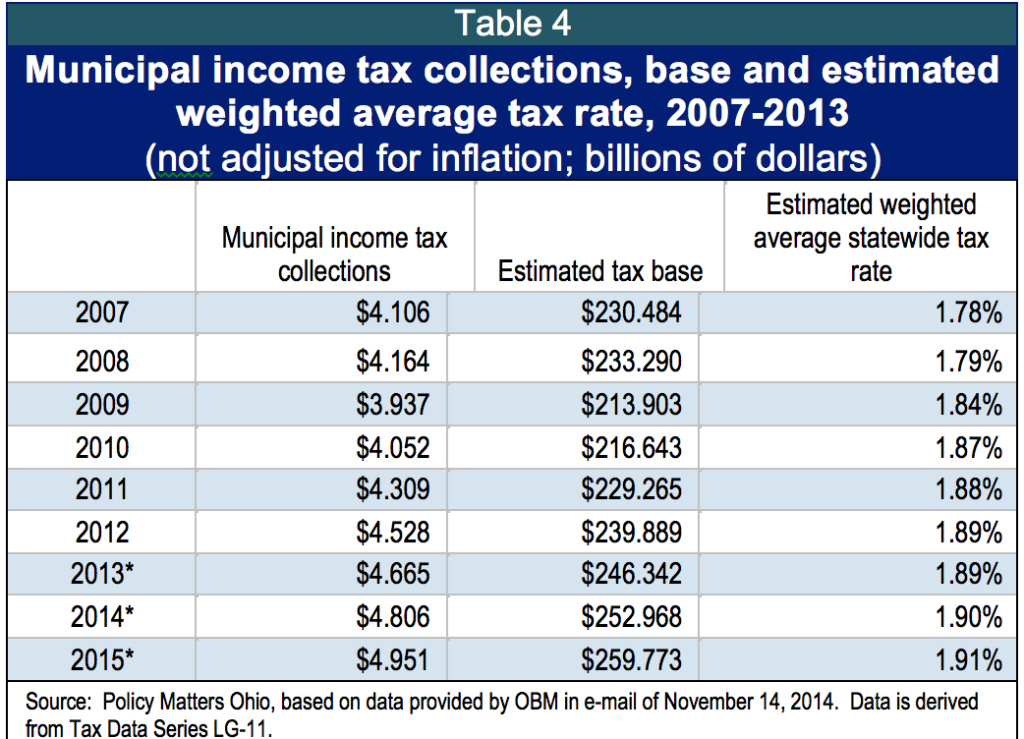
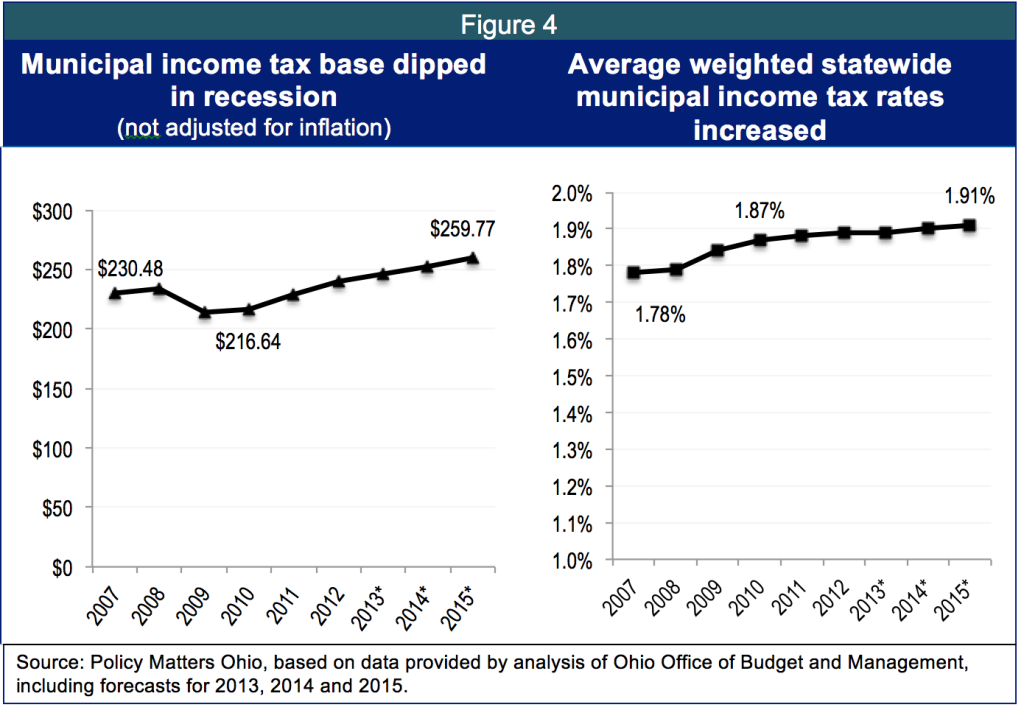
Income tax rates rose when the income tax base fell sharply in 2009 and stayed nearly flat in 2010. Table 4 shows OBM estimates for the local income tax base and rates. Based on these estimates from OBM, 38 percent of the growth in municipal income tax collections (not adjusted for inflation) resulted from rate increases between 2007 and 2015.[16] In fact, the $200 million increase in annual collections between 2007 and 2011 was all a result of rate increases, as the tax base remained flat. However, rate increases slowed between 2010 and 2012. Based on recent modest increases, OBM conservatively estimated small growth in average rates in their forecast. Between 2011 and 2015, only 1 percent of the non-inflation-adjusted increase in municipal income tax collections is projected to be the result of rate increases.[17]
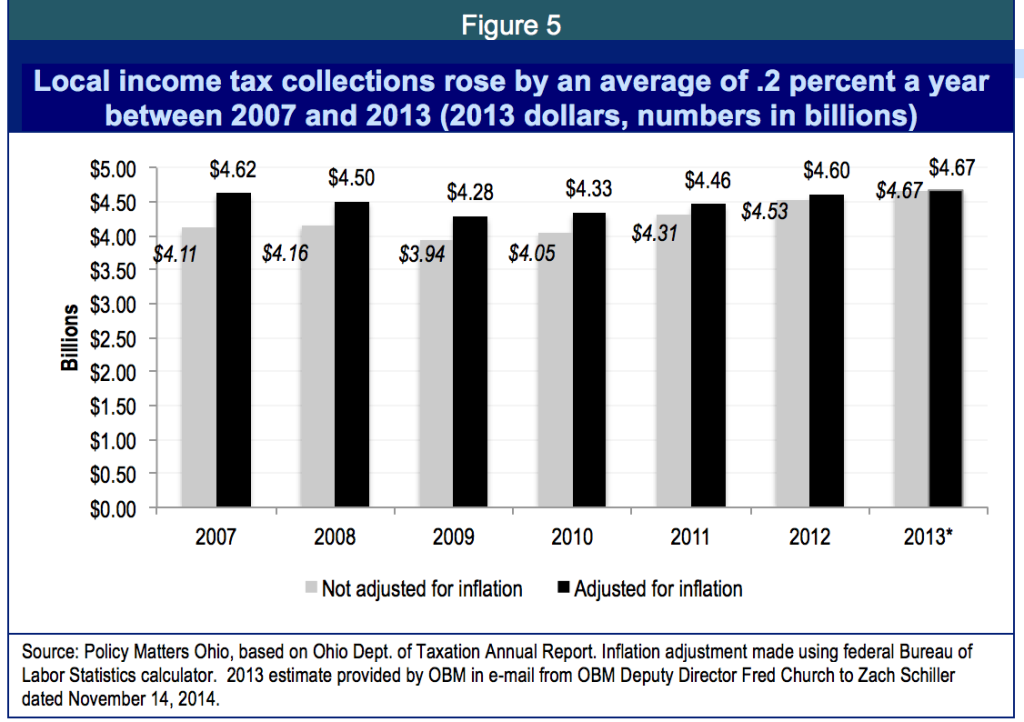
Figure 4 shows the dip in the value of the local income tax base in 2009, and a corresponding rise in rates as communities adjusted. The tax base grew with the recovery and rate increases moderated.Figure 5 shows collections for the municipal income tax (not including local school income taxes). Between 2007 and 2013, municipal income tax collections - adjusted for inflation - increased by an average of .2 percent yearly. OBM projects growth of 3 percent in 2014 and 2.9 percent in 2015.
Rate increases in large cities can mask fiscal conditions in other communities, or even in the rest of the state. For example, income tax collections by the City of Columbus rose by $119.7 million in CY2010 following a rate increase, yet municipal income tax collections for the state as a whole increased by just $115.5 million. A statewide view masks actual decline in revenues in many other cities and villages at that time.
Sales tax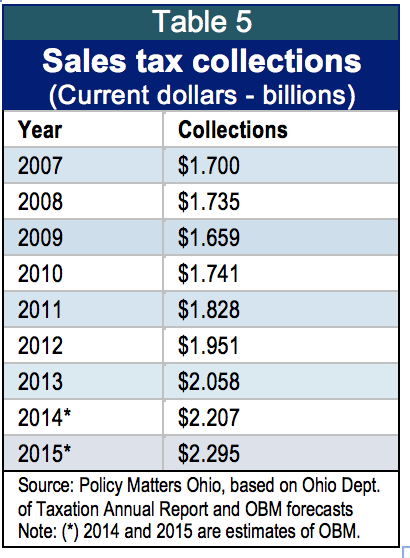
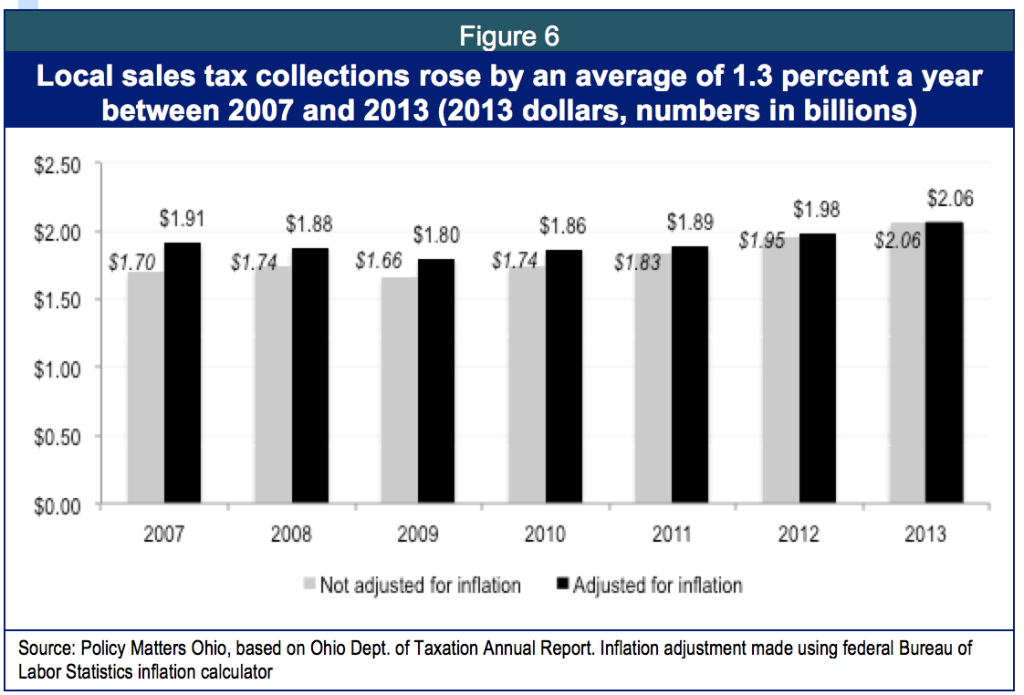
Figure 6 shows sales tax collections adjusted for inflation, which rose by an annual average of 1.3 percent between 2007 and 2013. Sales tax collections were at $2.058 billion in 2013 and are projected to be at $2.295 billion by 2015 in current dollars.
OBM projects 7.2 percent growth in the local sales tax in 2014, based on first-half 2014 revenues, tax rate increases and forecasted retail sales growth, with a return to more standard growth of 4.2 percent the following year.
With the sales tax, too, the actions of a few jurisdictions can mask underlying economic conditions. For example, Franklin County alone accounts for $90 million in sales-tax growth in 2014, OBM estimates. Marion County and Erie County, the two others with rate increases, contribute another $8 million. The three counties with rate increases accounted for $98 million – about two-thirds - of the $148 million in sales-tax growth forecast in 2014 compared to a year earlier.[18]
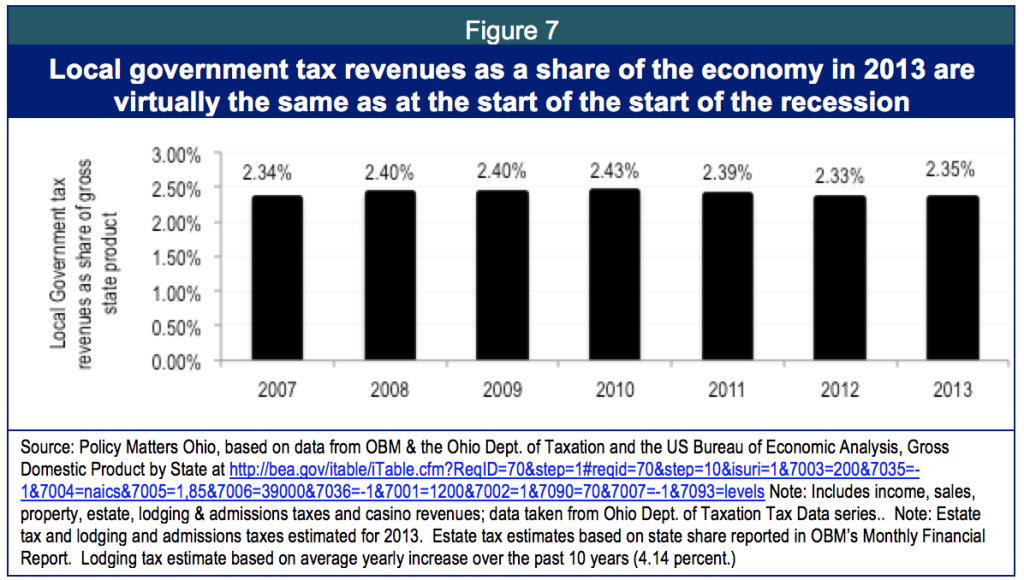
Growth or decline of local government tax revenue can be gauged by its share of the total Ohio economy. Figure 7 illustrates Ohio’s local government tax revenue (not including schools) as a share of Gross State Product between 2007 and 2013. During this time, this share of the economy has remained virtually flat. Total revenues from property, income, sales, casino revenues, estate taxes and lodging taxes made up 2.34 percent of Gross State Product (GSP) in CY 2007[19] and 2.35 percent in 2013.
Uneven recovery means many communities still struggle
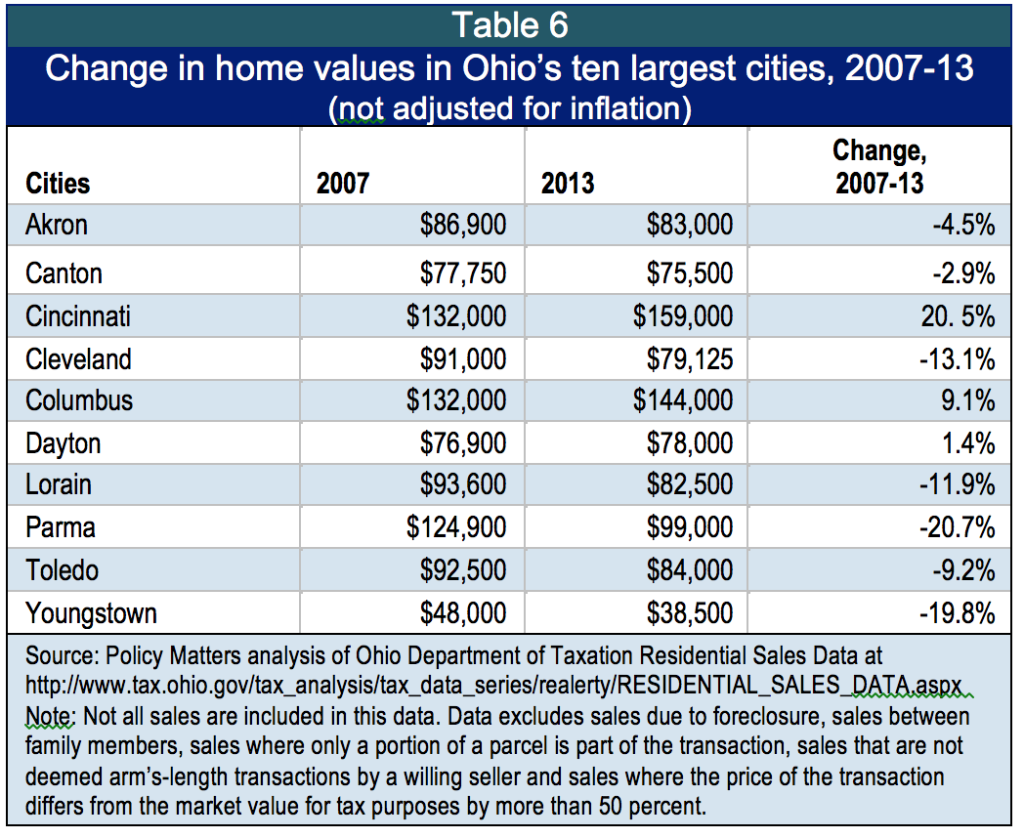
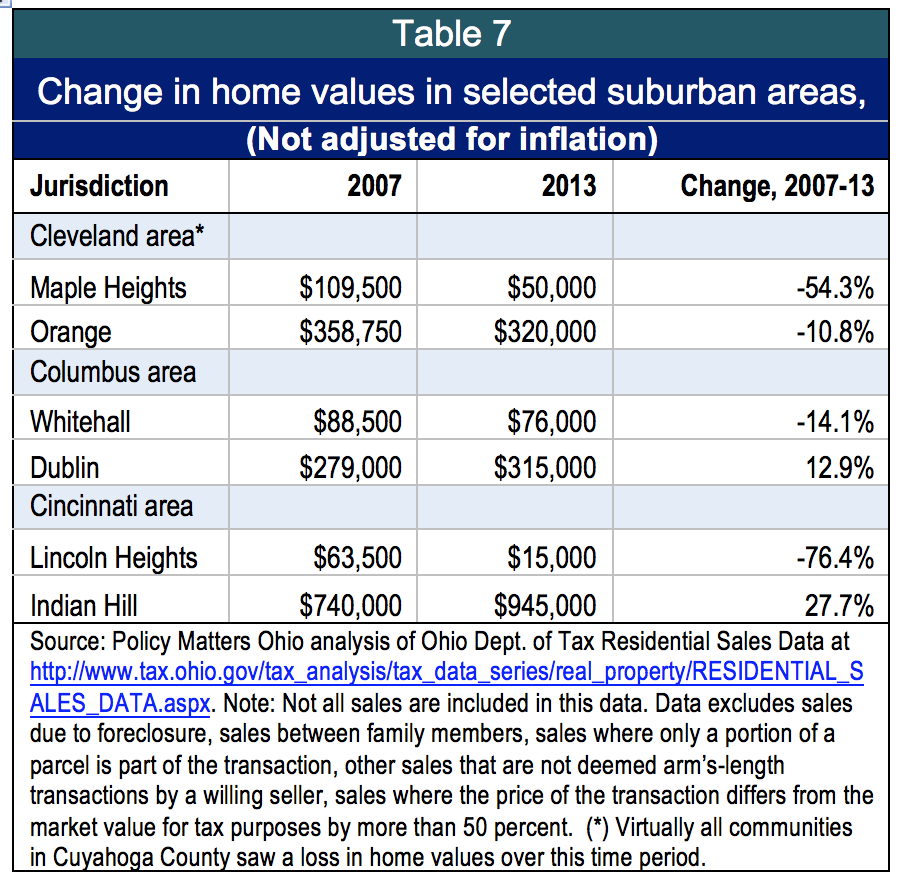
Aggregate property values are recovering, but many places continue to have declines. Table 6 shows trends in median home sales price in the state’s largest 10 cities between 2007 and 2013. Just three out of ten show a positive trend while four of the ten show double-digit plunges in values. Trends among smaller communities vary even more widely (Table 7). Lincoln Heights, near Cincinnati, has seen home values fall by 76.4 percent while nearby Indian Hill has seen values increase by 27.7 percent. Though the pace of foreclosures has slowed substantially from the height of the foreclosure crisis, the number is still nearly double the rate it was before the run-up in predatory lending early in the century. Ohio faces an enormous challenge in recovering. In Cuyahoga County alone, foreclosures have caused 24,000 vacant homes, of which 10,000 or more need to be demolished. The projected cost: more than $100 million for residential properties alone.[20] A conservative estimate by the Thriving Communities Institute found that Ohio had 50,000 vacant homes that required demolition. Even with local initiatives, resources from the federal government, and money from a national mortgage settlement, the cost of dealing with this blight will run hundreds of millions of dollars, which presents a challenge to the budgets of many jurisdictions.State cuts
In communities where the property tax base lags and the damage from foreclosure prevents recovery, state budget cuts have compounded fiscal problems. However, state funding cuts have not just affected those communities: the cuts have affected all jurisdictions in the state.[21]
Fact sheets from the Ohio Office of Budget and Management highlight the state’s reduction in funding to local government since 2010 (Table 8). In 2014 dollars, state funding for Ohio’s local governments, including funding for mandated services delivered locally, has fallen by $813.23 million dollars. (Table 8 does not include state funding for schools).
Table 8 highlights that state funding to local governments (not including schools) for all purposes – revenue sharing, mandated services and other – is $418.2 million less in 2015 than in 2010 in nominal dollars; adjusted for inflation, the gap is $813.2 million. Yet, even this tally of loss is not complete. For example, it does not include elimination of the estate tax. Between 2003 and 2012, $231.9 million a year was distributed to Ohio communities from this source. It was hoped casino tax revenues would make up for lost local government revenue. The funding from casino revenues that went to counties and municipalities in the last four quarterly distributions totaled $153.1 million. In total, this source does not replace loss of state budget cuts and other funding cuts to Ohio’s local governments.[22]
The state has changed its historic commitment to Ohio communities. The General Assembly continues to cut local resources – most recently through House Bill 5, which changed municipal income tax provisions and may cost localities millions or even tens of millions annually. [23] The $10 million provided in one time state funds to aid townships is helpful to those communities, but does not address larger cuts and stubbornly weak property tax values in many communities which undercut their ability to fully recover from damage of the recession.
Local government employment loss
Local government, like any service sector, is labor intensive. The number of people providing those services – security, garbage collection, traffic control, emergency services, and more – has dropped sharply. The Ohio Labor Market Information Current Employment Survey data tool shows that Ohio had 41,100 fewer local government employees in November 2014 than in November 2007.[24]
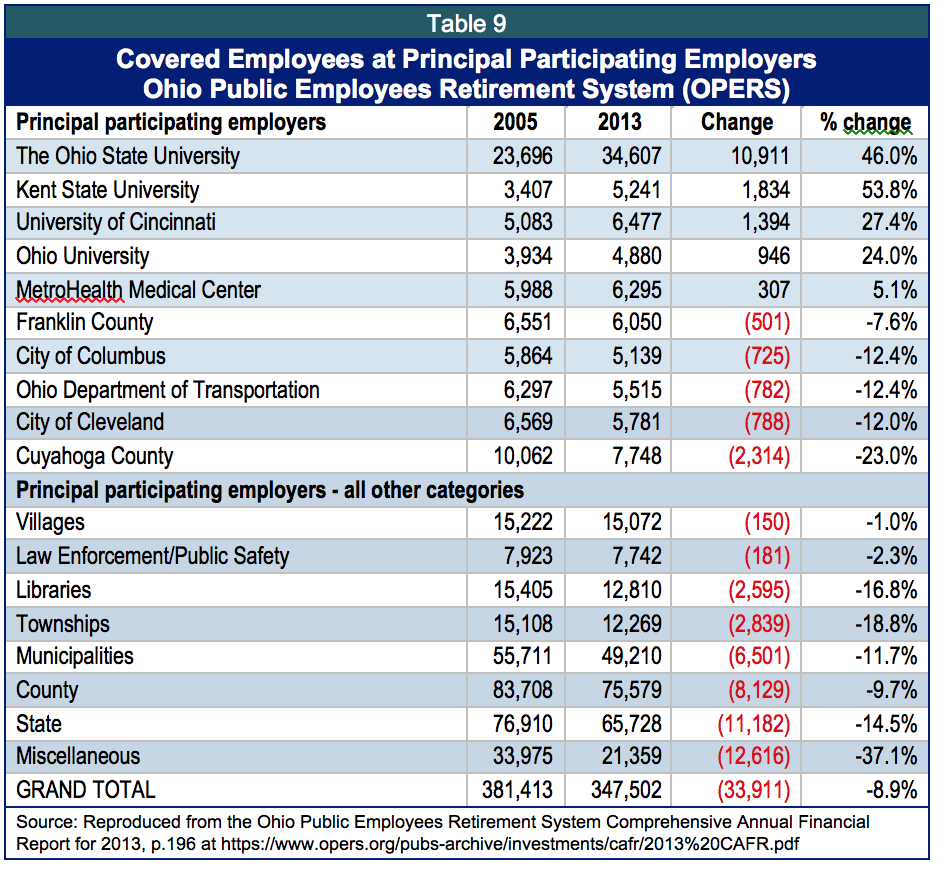
The annual reports of the public retirement systems provide detailed information on public employment. The Ohio Public Employment Retirement System (OPERS), one of several state and local retirement systems in Ohio, lost 33,911 active members between the end of 2005 and the end of 2013.[25] There was loss at all levels of government, although here was also gain at some institutions, notably related to health care, a fast-growing employment category (Table 9).
Reserve fundsReserve funds are an important indicator of the financial health of jurisdictions. In 2012, almost a third of Ohio’s jurisdictions either had lower-than-recommended levels of reserves or had expenditures that exceeded revenues. Many communities are not prepared for another downswing in the economy, a natural disaster, or further state budget cuts – the kind of situations adequate reserve funds can help a community weather.
In government accounting, “unassigned reserve funds” or “fund balances” provide a fiscal safety net for government. The state of Ohio maintains a rainy day fund and some local governments have their own policies for such funds. A primary objective of a fund balance policy is to maintain resources to cope with contingencies.
The size of Ohio’s local government reserve balances has received recent attention. Governor Kasich has said more than 90 percent of local governments in Ohio are running a surplus greater than the state’s 5 percent rainy day fund, stating “If you’re running a significant surplus, it’s kind of hard to argue that we should make your surplus bigger.”[26] However, that comparison is not apples to apples, because it compares a very large governmental unit (the state) with much smaller units (cities, villages and townships), and reserves needed for smaller jurisdictions differ from those required for larger ones.
The trade association of government finance officers, the Government Finance Officers Association (GFOA), recommends local governments retain at least 60 days of operating funds in reserve. They suggest that while reserve funds for very large units of government – like state government - might be as low as 5 percent of revenues or expenditures,[27] the recommended minimum for smaller units of government – like cities or counties - is 16.2 percent.[28]
However, there can be variation. The GFOA conducted a study to determine the right level of reserves for Colorado Springs and recommended 25 percent because of risks and uncertainty, including uncertainty around sales tax collections, legal liability, infrastructure concerns and the need for expanded emergency reserves as climate change increases weather damage. Reserves of similar cities reviewed as part of the study showed wide variation: Fort Collins had 23.1 percent; Oklahoma City, 12.7 percent; Denver, 18.3; Indianapolis, 56.9 and Charlotte, 17.3. The average unrestricted funds for comparable cities considered in the study ranged between 20 and 25 percent. The wide range of “best practice” cities included as comparables illustrates how different jurisdictions may need different reserves.[29]
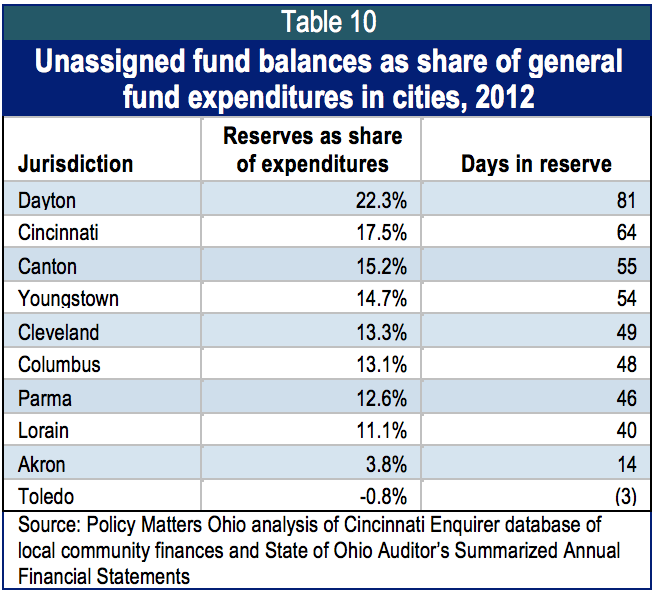
The Cincinnati Enquirer and Gannett Ohio prepared a database of local government finances, based on the Auditor’s Summarized Financial Statements.[30] One indicator covered was rainy day funds as a share of expenditures for the cities, villages, townships and counties in the Auditor’s database. The database included complete financial data for 2,276 Ohio local governments in 2012. Of this group, nearly a third - 31.9 percent - had less than the recommended minimum reserves of 16 percent of expenditures. An even larger share of townships, which are not required to report reserve funds, had expenditures that exceeded revenues. Of the 637 villages with general fund revenues and expenses in the database, 110 or 17.3 percent had smaller reserves than recommended. Of the 253 cities, more than a quarter (69 cities or 27.3 percent) failed to reach the recommended level of reserves – including eight of Ohio’s 10 largest cities (Table 10).
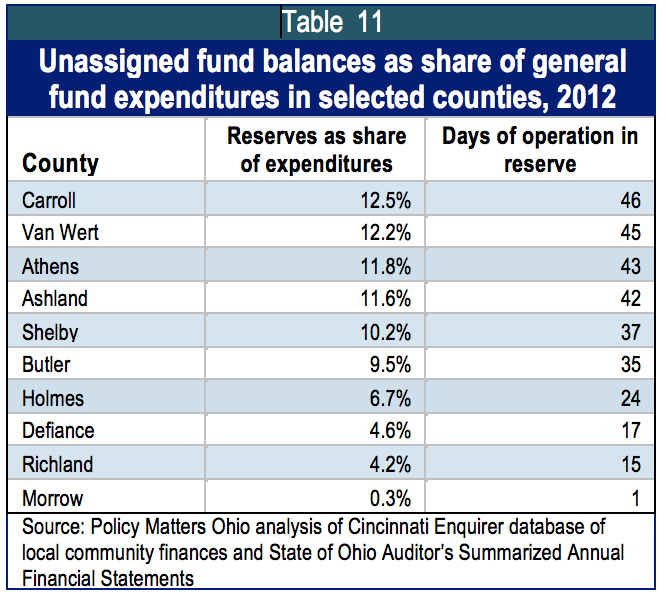
Many counties remain in precarious financial situations. Of those that use accrual accounting and report expenditures and unassigned fund balances, more than a quarter have less than recommended reserves. The 10 with the lowest reserves are in rural places across the state (Table 11). An aggregate view masks individual reality of different jurisdictions. Small places like Hunting Valley, with a sizable estate tax payment in 2012 that caused it to have a huge surplus, can skew overall impressions.[31] The receipt of estate tax payments provided many places with funds for capital expenditures and the purchase of big-ticket items like fire trucks and police fleets. Hamilton Finance Director Tom Vanderhorst testified to the Senate Ways and Means committee: “The City of Hamilton currently has about $8M in reserves or roughly 20% of GF expenditures. Oddly enough, the reserve was created by an estate tax windfall received in 2011, otherwise, we would have been cutting even more services before now.”[32]Conclusion
The economic recovery in Ohio has been slow and unevenly spread across communities. Revenues from the three major local tax sources grew very slowly between 2007 and 2013, due in significant measure to change in tax rates, which rose as the recession hammered property values and the income tax base. Funds needed to repair the damage of the recession were not available to many communities. The General Assembly continues to cut local resources – most recently through House Bill 5, which changed municipal income tax provisions and could cost municipalities millions of dollars. The $10 million provided in one-time state funds to aid townships in the waning hours of the 130th General Assembly is helpful, but does not address larger cuts and stubbornly weak property tax values in many communities, which undercut their ability to fully recover from the recession.
The Kasich administration forecasts increase in local revenues in 2014 and 2015, but OBM factsheets reveal hundreds of millions of dollars local governments have lost in reduced state aid and program subsidies. The administration has also pointed to reserve funds of local governments to demonstrate fiscal health, but the level they identify as a healthy reserve (5 percent) is a third of the level recommended by the Government Finance Officers Association. In terms of industry best practice, almost a third of the municipalities and counties listed in the Cincinnati Enquirer database lack adequate reserve balances to weather emergencies, natural disaster, or unexpected expenses.
Local finances are worse in some places than in others. Property values are still below pre-recession levels on a statewide basis, with recovery not forecast until 2017. Some communities, like Lincoln Heights outside of Cincinnati, where median home values fell by 76 percent, or Maple Heights outside Cleveland, where median home values fell by 54 percent, have much longer to wait.
Many places raised local tax rates, accounting for a significant share of the gain in local tax revenues. However, state budget cuts undermined increased local efforts. Communities are hundreds of millions short of what they need to repair the physical damage of the foreclosure crisis. Local governments employ 41,100 fewer people than before the recession.
Local public services support our quality of life, protect family wealth and underpin opportunity. We all deserve sound, dependable services and stable public finance. Ohio’s communities need more support from the state and a period of stability - without cuts or threats - to recover, rehire and rebuild.
[1] Public Children’s Services Association of Ohio, “PCSAO and Child Welfare Financing,” June 2013 at www.pcsao.org/Presentations/2013/Child Welfare OH Financing Execs 6 13.pdf
[2] University of Colorado, State of the States in Developmental Disabilities, “State profiles for I/DD during fiscal years 1977-2011 at www.stateofthestates.org/index.php/intellectualdevelopmental-disabilities/state-profiles.
[3] Testimony of Mayor John Cranley of Cincinnati and Commissioner Clarence Coleman of Toledo on House Bill 5 to the Senate Ways and Means Committee, November 18, 2014 at http://www.ohiosenate.gov/committee/ways-and-means#
[4] Letter from Mayor Frank Jackson to Senate Ways and Means Committee Chair Schaffer and Vice-Chair Peterson, in testimony of Nassim Michael Lynch to the Senate Ways & Means Committee on December 2, 2014 at http://www.ohiosenate.gov/committee/ways-and-means#
[5] Tim Riordan, City Manager of Dayton, testimony to the Senate Ways & Means Committee on November 18, 2014 at http://www.ohiosenate.gov/committee/ways-and-means#
[6] Jack Netis, Orwell Village Manager, testimony to the Senate Ways & Means Committee on November 18, 2014 at http://www.ohiosenate.gov/committee/ways-and-means#
[7] Ohio Office of Budget and Management, “Fact Sheet: Funding Ohio Communities,” 2013, at http://beyondboundaries.ohio.gov/documents/statesupport/LGF_Fact-Sheet.pdf and “Funding Ohio Communities,” 2014, at http://www.healthtransformation.ohio.gov/LinkClick.aspx?fileticket=7kfh1pXjPlc%3D&tabid=149.
[8] Zach Schiller, “Kasich Administration Moving Against History, Hurting Ohio’s Future,” Policy Matters Ohio, September 17, 2013 at http://www.policymattersohio.org/testimony-sep2013
[9] E-mail from Meghan Sullivan-Homsher, Ohio Department of Taxation, to authors, 11/4/2014.
[10] Ohio Department of Taxation, “Brief Summary of the Real Property Tax” at http://www.tax.ohio.gov/portals/0/communications/publications/brief_summaries/2009_brief_summary/property_tax_real.pdf
[11] OBM’s projections of future values are based on economic forecasts that estimate new construction and prices for existing homes. Tax rates are projected based on these property-value projections and the historical relationship between property values and tax rates. That relationship includes both the rate changes that occur because of the reduction factors in Ohio law, and because voters may approve new levies. OBM assumed that the relationship would remain the same, and did not attempt to predict any change in voter approval of new levies. Interview of Zach Schiller with OBM Deputy Director Fred Church, Oct. 20, 2014.
[12] The Ohio Department of Taxation’s annual report notes that the difference between the gross millage rate and the effective rate is explained by Section 319.301 of the Revised Code, which generally prevents increases in voted taxes when the valuation of existing real property is increased.
[13] Revenues are based on taxes charged, before the property tax rollback and homestead exemption funding provided by the state.
[14] Zach Schiller interview with OBM Deputy Director Fred Church, Oct. 20, 2014.
[15] Ibid.
[16] OBM estimated municipal income tax based on the forecasted growth in wage and salary income and the historical relationship between the growth in the tax base and the growth in that category of income. It also projected a small increase in the statewide average effective tax rate in 2013, 2014 and 2015. E-mail from OBM, Sept. 24, 2014, interview with Fred Church, Oct. 20, 2014, and email from Church, Nov. 14, 2014. These estimates were prepared prior to the passage of House Bill 5, the municipal income tax overhaul passed in December 2014, which is expected to reduce tax collections. The OBM forecast for municipal income taxes was available only through 2015, although a longer forecast was provided for real property tax base and rates.
[17] Data in this paragraph from interview with OBM Deputy Director Fred Church, Oct. 20, 2014, and email from Church, Nov. 14, 2014.
[18] Interview by Zach Schiller with Fred Church of OBM, October 20, 2014.
[19] The recession officially started in December of 2007. The first year of the recession was 2008.
[20] Vacant and Abandoned Property Action Council, “Housing and Community Development Recommendations for Cuyahoga County Executive Armond Budish,” Nov. 4, 2014
[21] See Wendy Patton, “Intensifying Impact” and “A Thousand Blows,” Policy Matters Ohio at www.policymattersohio.org
[22] The casino revenues generate funds for schools in addition to local governments. Over the past most recent four quarters, funding for schools has totaled $92.94 million. This does not begin to replace loss of tax reimbursements to schools.
[23] See Fiscal Note for House Bill 5 of the 130th General Assembly, as passed by the Senate on the floor, at http://www.lsc.state.oh.us/fiscal/fiscalnotes/130ga/hb0005sp.pdf; see also “HB 5 continues assault on local services,” Innovation Ohio, November 20, 2014 at http://innovationohio.org/2014/11/20/hb-5-continues-assault-on-local-services-pushes-total-cut-to-communities-to-495-million-a-year/
[24] Ohio Labor Market Information, Current Employment Statistics at http://ohiolmi.com/asp/CES/CES_GET.asp.
[25] Ohio Public Employees Retirement System Comprehensive Annual Financial Report for 2013 at https://www.opers.org/pubs-archive/investments/cafr/2013%20CAFR.pdf. Gains in some sectors – universities with medical schools and hospitals - reflect growth in health care.
[26] Jim Siegel, “John Kasich, Ed Fitzgerald disagree on tax cuts,” The Columbus Dispatch, September 21, 2014 at http://www.dispatch.com/content/stories/insight/2014/09/21/01-kasich-fitzgerald-disagree-on-tax-cuts.html
[27] Stephen J. Gauthier, GFOA Updates Best Practice on Fund Balance, Government Finance Accounting Review, December 2009 at http://www.gfoa.org/sites/default/files/GFR_DEC_09_68.pdf. The State of Ohio’s rainy day fund can be no greater than 5 percent.
[28] See GFOA Best Practice, “Appropriate Level of Unrestricted Fund Balance in the General Fund” (2009), www.gfoa.org. The Best Practice states that reserves equal to about 16 percent of revenues or expenditures is the minimum a government should consider for its policy and that the actual target that a government adopts should be based on an analysis of the salient risks that a government faces (which in many cases may call for a higher reserve level than 16 percent). Cited in Kavanahugh, Op.Cit.
[29] Shayne C. Kavanaugh, A risk based analysis of General Fund Reserve Requirements, Government FInancal Officers Association, 2013 at http://www.gfoa.org/risk-based-analysis-general-fund-reserve-requirements
[30] Chrissie Thompson, Jessie Balmert and Jona Ison, “Database: Is Your Community Strapped for Cash,” The Cincinnati Enquirer and Gannett Ohio (Cincinnati.com) at http://www.cincinnati.com/story/news/politics/elections/2014/09/07/despite-complaints-local-governments-ok/15232123/); database (desktop: http://www.cincinnati.com/story/news/politics/2014/09/05/database-tracking-ohio-money/15134133/; mobile/desktop: http://bridge.caspio.net/dp.asp?AppKey=b2de0000ca800eca5d084eaab2d2).
[31] Fran Suda, “Hunting Valley workers will get smaller pay hike,: Sun News at http://www.cleveland.com/chagrin-valley/index.ssf/2013/01/hunting_valley_workers_will_ge.html
[32] Testimony of Tom Vanderhorst to the Senate Ways & Means Committee on HB 5 (Municipal Income Tax Reform), November 19, 2014 at http://www.ohiosenate.gov/committee/ways-and-means#
Tags
2015Local GovernmentRevenue & BudgetWendy PattonZach SchillerPhoto Gallery
1 of 22
