Ohio Budget 101
December 19, 2022
Ohio Budget 101
December 19, 2022
Your guide to Ohio's state budget
Ohio should use our shared resources to do the most good for the most people, across race and place, of every gender, age and ability. Every two years, our representatives in Columbus have an opportunity to create a state budget that does just that. State lawmakers decide whether to spend on things that benefit everyone, like public schools, libraries and parks; and clean air, water and soil; or to use our public resources to benefit the wealthy and powerful few. They decide whether to use our budget to help all Ohioans have a brighter future by dismantling barriers that hold people back because of their race, gender, ability or where they’re from — or to double down on the divide-and-conquer mindset that keeps us trapped in the past. Their decisions determine how well we can look after the littlest Ohioans and senior citizens, care for people who are sick and those recovering from addiction or mental illness, and help our neighbors get back on their feet in tough times.
What’s in Ohio’s budget?
Figure 1
Education
Public primary and secondary (K-12) education makes up the largest share of state spending, at 42.8%. Public education ensures Ohioans of all walks of life have the knowledge and experience required to participate in our democracy and in the workforce. It allows young people to pursue their dreams and prepares new generations of doctors and nurses, community leaders, engineers, electricians and the rest of our workforce. Plus, public schools employ teachers, administrators and other staff, creating jobs for working people all over the state. It’s no wonder that we give education top priority in our state budget.
In the current budget — which ends June 30, 2023 — Ohio’s K-12 education system fares better than it has in decades. That’s because a coalition of teachers, parents, students, union members, administrators and advocates from all over the state pushed for the Fair School Funding Plan (FSFP), and forced lawmakers to listen. The FSFP improves Ohio’s school funding formula, the method lawmakers use to determine how much funding each school will receive, to make it more fair for all kids in all public schools. However, the plan will take six years to make up for years of underfunding — and lawmakers only funded the first two. So, in the upcoming budget debates, we’re coming together again to fully fund the FSFP, so every kid in Ohio, regardless of their ZIP code, can attend a great public school.
Medicaid
One of the most important ways Ohioans use our pooled resources to help each other is by helping our neighbors afford the health care they need. The best available tool for doing that is Medicaid, which covers 3.5 million Ohioans. The federal government currently pays about two-thirds of the cost of regular Medicaid in Ohio — somewhat more than usual because of increased aid during the pandemic — and the rest comes from the state itself. Together, we provide billions in funding that pays for health care and supports jobs in hospitals, clinics and doctor’s offices across the state.
If you include all that federal money (almost $12 billion in 2022) in our state budget breakdown, Medicaid accounts for the greatest share of our budget, roughly 45%.
Since federal Medicaid funds can only be used for Medicaid programs, and since only the state share of Medicaid funding comes directly from a state’s own resources, most states don’t include federal Medicaid aid in their budgets, and state budget advocates focus on the state’s share only. We can get a clearer picture of state lawmakers’ priorities by looking at the “state share” budget, which does not include federal funds that are earmarked for particular purposes. Doing that changes the picture significantly. As shown in Figure 1, Ohio’s share of Medicaid spending then accounts for 16% of the state budget. (That’s about $4.3 billion in 2022.)
Local governments
Ohio lawmakers used to share more of our state resources directly with cities, towns and other municipalities around the state to help pay for all manner of local public services, including public health and child protective services, fire departments and trash pick-up. But now, local governments are working with about $1 billion less each year than they were in 2011, adjusting for inflation. That’s $1 billion every year that could be helping all of us live healthier, happier lives.
Everything else
The state budget funds Ohio’s Department of Agriculture and Department of Natural Resources; Rape Crisis Centers and programs to prevent domestic violence; a project to expand broadband access mostly in rural and Appalachian communities, and many other critical public services, agencies and initiatives.
Between now and the end of June, Gov. DeWine and the Ohio House and Senate will make major decisions about funding for Medicaid, public education, and the many other services included in the two-year state budget beginning July 1, 2023. Those decisions affect every one of us, so all of us should have a say. By speaking as one, we can tell our elected leaders how to distribute our collective resources. If we don’t, the wealthy and powerful will. And too often, what’s good for the rich is bad for the rest of us.
Focus on the General Revenue Fund
As advocates, we’re likely to have the most impact on the part of the budget called the General Revenue Fund (GRF). It’s where nearly all our state taxes go. While there are other state budgets, such as one for transportation, the GRF is the largest. It is the major source of funding for state agencies and thus for many of the programs, services and departments that help — or have the potential to help — all Ohioans do better. As enacted, Ohio’s GRF for Fiscal Years 2022-2023, which begin on July 1 of each year, contains $74 billion.Where does the money come from?
The vast majority of the General Revenue Fund (GRF) comes from the state sales taxes (48%) and state income tax (36%):
Figure 2
The income tax is the only tax that varies depending on ability to pay: Those who have higher incomes pay more in taxes, and those with lower incomes pay less. It’s the fairest way for taxes to work, but most aren’t set up that way. Instead, Ohio lawmakers have been changing the tax code to increasingly rely on taxes that require people with less money to pay a higher share of their income than people with more. Sales tax is the biggest example: Everyone pays the same sales tax rate, but affluent people, unlike many regular Ohioans, don’t spend most of their income just covering the basics of daily life, and more of what they spend isn’t covered by the sales tax.
Since 2005, Ohio’s lawmakers have made the GRF less reliant on the income tax and more reliant on the sales tax, as shown in Figure 3. Those changes do even more to help the wealthy, at the expense the Ohio households with incomes under $65,000 who are, on average, paying more than they were 17 years ago.
Figure 3
The relative fairness of the income tax is not nearly enough to offset Ohio’s “great tax shift.” The upside-down tax structure, which, when you factor in all state and local taxes, requires the wealthiest to contribute the smallest share of their wealth — and the people with the lowest wages pay the highest rate. Policymakers can change the tax code to be more fair and equitable in the state budget, or to be less fair and less able to support quality public services.
Figure 4
Who pays?
Ohio lawmakers have chosen time and again to weaken our state budget with tax cuts for the wealthy that shortchange the rest of us. Since 2005, Ohio lawmakers have shifted public resources away from working families of all races, and urban, suburban and rural communities across the state. They’ve diverted more and more to the wealthy and well-connected through tax cuts and special-interest giveaways.
Figure 5 shows how Ohio lawmakers have given the wealthiest 1% over $50,000 every year in tax cuts on average. Meanwhile, households making less than $65,000 actually pay more on average in taxes today compared to what they did in 2005.
Figure 5
Source: Institute on Taxation and Economic Policy, December 2021, based on estimated 2022 incomes. Includes Ohio residents only.
As a result, every year the people of Ohio have 8.2 billion dollars less in revenue than we would have had without those changes. That’s $8.2 billion that could be used to fund our schools, colleges, nursing homes, health care, Job and Family Service agencies, child welfare agencies, parks, food banks, and much more.
Figure 6
Source: Legislative Budget Office of the Legislative Service Commission https://www.lsc.ohio.gov/documents/reference/current/historicalexpendrevenue/table1.pdf
And remember: The rich and powerful have been hoarding billions of dollars of our revenue each year for more than a decade. In fact, Ohio spends less today than it did in 2007, adjusting for inflation. (See Figure 7.) State lawmakers haven’t just chosen to put our critical public services in a deep hole; they’ve kept digging, deeper and deeper, for going on two decades. And we’re the ones who pay the price.
Figure 7*
*For more on using inflation adjustment to understand Ohio's budget, check out this blog from State Policy Fellow Guillermo Bervejillo, Ph.D.
Ohioans pay the price for tax cuts
Except for the wealthy few, Ohioans experience real, measurable consequences for all the ways lawmakers have opted to weaken our state. As shown in Figures 8-11, Ohio now ranks among the worst states in the country for infant mortality, child poverty and food insecurity, opioid-overdose death rate, and a range of other factors that make life harder for those who shoulder the costs of all those tax cuts.
Figure 8

Source: America’s Health Rankings analysis of CDC WONDER, Linked Birth/Infant Death Files, United Health Foundation, AmericasHealthRankings.org, accessed 2022.
Figure 9

Annie E. Casey Foundation. Kids Count Data Center analysis of data from the U.S. Census Bureau, American Community Survey.
Figure 10

Source: Map the Meal Gap 2020, Feeding America, Childhood Food Insecurity module.
Figure 11

Source: Kaiser Family Foundation analysis of Centers for Disease Control and Prevention (CDC), National Center for Health Statistics. Accessed 2022.
We all benefit when we use our resources to do the most good
A few good budget decisions have helped Ohioans. For example, Ohio’s decision to expand Medicaid made a difference in people’s lives across the state. As of October, more than 935,000 Ohioans were enrolled in Medicaid expansion. That’s one reason the share of uninsured Ohioans (5.4%) is lower than in 39 other states.
Figure 12

Source: Kaiser Family Foundation estimates based on the Census Bureau's March Current Population Survey (CPS: Annual Social and Economic Supplements), 2017-2022.
Despite earlier cuts, our public library system has had strong support from the state, and it’s among the best in the country:
Figure 13

Source: Institute of Museums and Libraries, Public Libraries Survey, 2020. Accessed 2022.
But the benefits of these good decisions are far outweighed by the harm lawmakers do with their ineffective tax cuts for the rich and powerful few. A people-first budget can make Ohio a better place to live, work and raise a family. That’s what we elect lawmakers to do. Let’s remind them.
We can have a say in Ohio’s budget
Decisions about Ohio’s budget are decisions about our future. Too often, state leaders put working Ohioans and their families too far down their list of priorities. Too often they use their power to try to divide us, pitting rural communities against urban ones, Black communities against white ones, young people against senior citizens — any wedges they can drive to keep us fighting each other while they make out like bandits, and make sure their wealthy donors do, too. But when we stand together, we are so much more powerful than them. When we speak with one voice and demand our communities get the share of resources that our work makes possible, we can have an impact. In the last budget cycle, we came together across race and place to push for and win a Fair School Funding Plan that made our school funding formula more equitable. We can win again by pushing for a budget that puts people first, so Ohio becomes the great state we know it can be, where everyone can thrive, no matter how much they have in their bank account.
Resources
When it comes to understanding how the state budget affects the daily lives of regular Ohioans, Policy Matters Ohio has you covered. Our goal is to demystify the budget, so more Ohioans take part in the process of creating it. As the People’s Think Tank, we’re always working to provide data and analysis that are accessible, useful and actionable. If you have any questions about anything you see here, please reach out to our Budget Researcher, Will Petrik at wpetrik@policymattersohio.org or our Research Director, Zach Schiller at zschiller@policymattersohio.org.
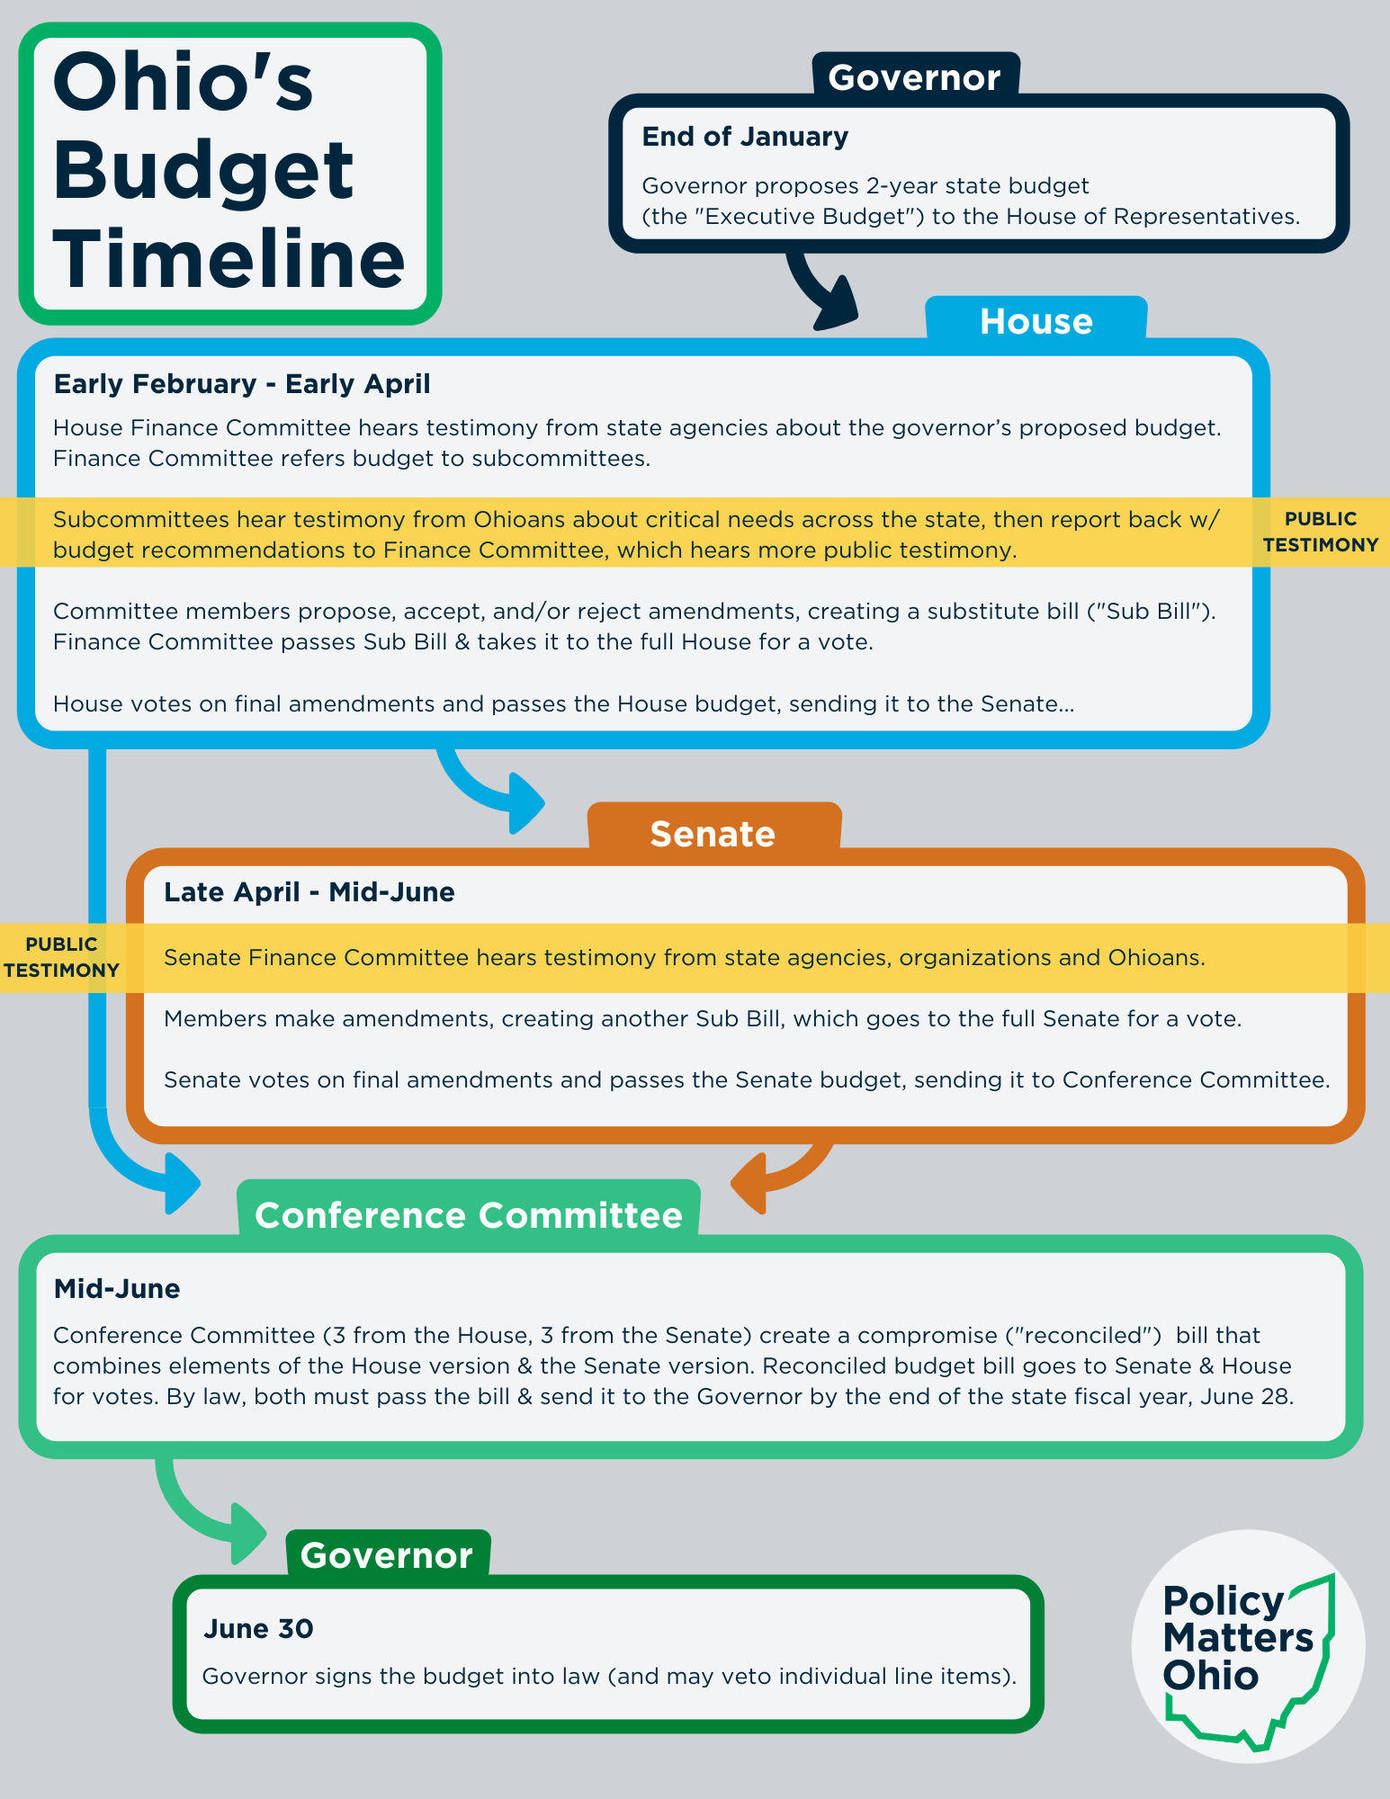
This timeline breaks down the budget process and highlights opportunities for public comment. Those moments are our best chance to influence the decisions our representatives are making on our behalf.
This table provides a searchable, sortable index of Policy Matters Ohio’s 2022-23 budget analysis.
For more details, see our full analysis of the 2022-23 budget.
For an even deeper dive, check out this collection of budget documents from Ohio’s Legislative Service Commission.
Tags
2022Ben SteinBudget PolicyRevenue & BudgetPhoto Gallery
1 of 22