Ohio budget fails to make needed investments
December 21, 2015
Ohio budget fails to make needed investments
December 21, 2015
Contact: Wendy Patton, 614.221.4505
Executive summary
 Ohio’s budget for fiscal years 2016-17 restored some recent deep cuts. After a decade of high needs and slashed services, it is not enough to move Ohio ahead. In this paper, Policy Matters Ohio prepares for a new year with a review of state budget trends since 2008.
Ohio’s economy remains weak. We did not recover the jobs we had at the official start of the last recession until October 2015, over a year after most other states recovered. Our poverty rate is stuck above where it was before the recession. Median income remains lower than the national average and far below previous peaks, when adjusted for inflation.
Public policy plays an important role in helping people and businesses get ahead. It creates a platform that allows families and employers to build a future.
House Bill 64, Ohio’s 2016-17 budget bill, gave large tax cuts to the richest, constraining the state’s ability to make investments. While the draconian funding cuts following the recession have been restored in many areas, investment in the decade between the recession and the end of the new budget will barely rise above inflation, despite deepened poverty and increased needs. More is needed to fix gaps in the safety net, address the damaging effects of low-wage work, help Ohioans train for better jobs and repair the damage of the recession in communities. This report reviews policy and investment changes in House Bill 64. Findings include:
- Tax policy: The richest Ohio households get a tax cut, but the poorest pay more, on average, under a set of changes that cut the income tax. Meanwhile, despite three years of consideration, the General Assembly has yet to strengthen Ohio’s weak tax on oil and gas production. Nor has the legislature authorized a permanent mechanism to review all of the $8.5 billion in annual tax breaks. A tax policy study group was established to review the state tax system.
- Local government: The state continued to cut revenue sharing – by $124 million, not adjusted for inflation – and use the proceeds to cut taxes for the rich, boost the rainy day savings account and restore state programs. This hurts the ability of localities to provide essential services and hurts the economy by cutting jobs of public workers. Since 2008-09, the loss of state aid to communities is close to $2 billion – not adjusted – on a biennial basis.
- Early learning and childcare: Ohio’s investment rose and fell over the decade, but funding in the current two-year budget period is the same as in the 2008-09 budget period, adjusted for inflation. We’re serving more children in public childcare and fewer in early learning. Overall, quality has been hurt, opportunity narrowed. A boost of $118.9 million (not adjusted) in HB 64 compared to the prior budget will improve enrollment in pre-kindergarten, provide a small increase in initial childcare eligibility, eliminate co-pays for the poorest and smooth the childcare “cliff.”
- K-12 education: Schools have had a bumpy fiscal ride since the recession. School formula funding is 3.2 percent or $552 million below the 2008-09 budget in inflation-adjusted dollars. This is despite HB 64’s boost of $1.25 billion or 8.2 percent (not adjusted). Even so, some districts will be worse off as tax reimbursements are phased out, despite subsequent legislative action.
- Higher education: The 2016-17 budget provides $1.18 million less than in the 2008-09 budget (adjusted for inflation). This is in spite of HB 64’s boost of $369 million, 7.8 percent above the prior budget (not adjusted). More is needed, particularly in need-based financial aid, which is hundreds of millions below 2008-09.
- Medicaid expansion brought federal dollars to all corners of the state and provided badly needed health care services to 630,000 Ohioans. Legislators are seeking a federal waiver of Medicaid rules that would impose premiums and penalties on the poorest Ohioans, threatening access to health care for many.
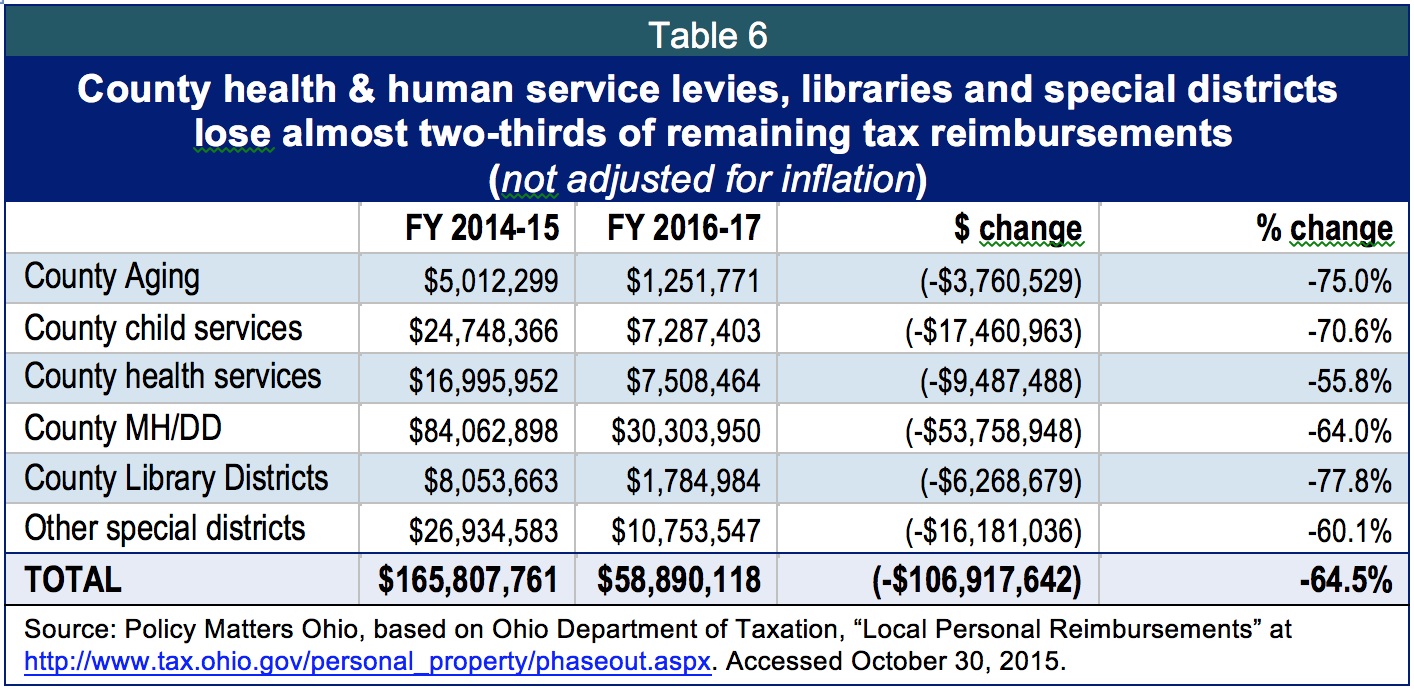
- Human services get new investment in protective services; Ohioans with developmental disabilities will have more opportunities to get services through home and community-based services, and a new approach to case management could help people who need work get training and employment. At the same time, local human service levies for seniors, children, mental health and other services lose millions of dollars through the phase-out of tax reimbursements.
- Corrections will get new funding, but not enough to ameliorate significant overcrowding that has, over time, fostered violent assaults on guards. The Department of Youth Services budget will contract as the number of incarcerated youth shrinks, but little is known about the number of young people entangled in the judicial system across 88 county youth correction systems.
Introduction
Over the past seven years – starting with the onset of recession -- Ohio budget and tax policies have failed to provide the opportunity and investments needed for the state to enjoy a more robust economic recovery.The new year will offer new opportunity to move Ohio forward as state agencies prepare for the next budget. To help promote policy decisions that will benefit all Ohioans, a look back at trends since 2008 is useful.
Ohio’s budget for fiscal years 2016-17 restored some recent deep cuts. After a decade of high needs and slashed services, it is not enough to move Ohio ahead.
Ohio’s economy remains weak. We did not recover the jobs we had at the official start of the last recession until October 2015, over a year after most other states recovered. Our poverty rate is stuck above where it was before the downturn. Median income remains lower than the national average and far below previous peaks, when adjusted for inflation.[1] Only one of the dozen largest occupational categories pays enough to make a parent with two small children self-sufficient in most Ohio cities.
Public policy plays an important role in helping people and businesses get ahead. It creates a platform of critical goods and services – clean water, safe streets, adequate safety nets, good schools and college opportunities – that allow families and employers to build a future.
House Bill 64, Ohio’s 2016-17 budget, once again gave large tax cuts to the richest, constraining the state’s ability to make investments. While the draconian cuts following the recession have been restored in some areas, deep cuts in the decade between the recession and the end of the new budget have left some critical services eviscerated in the face of deepened poverty and increased needs. More is needed to fix gaps in the safety net, address the damaging effects of low-wage work, help Ohioans train for better jobs and repair the damage of the recession in communities.
Inadequate state investment is made worse by declining federal funds. For example, the federal Child Care and Development Block Grant, which supports public childcare for low-wage workers, is reaching the smallest number of children in 15 years.[2] Ohio’s public childcare program has seen big cuts as well. Even with some modest improvements in the 2016-17 budget, Ohio ranks near the bottom of the states in eligibility for childcare aid. Inadequate investment in critical services for Ohio families means the state is missing opportunities to improve lives. Officials across the spectrum voice enthusiasm for work supports like childcare and for human services. Yet without adequate investment, new initiatives and mandates remain largely empty promises.
The years since 2008 have seen recession and recovery. State budget and tax policy included deep cuts in taxes and spending. Over the past decade, spending did not keep pace with inflation. House Bill 64 restored some services, but more investment is needed to address the needs of the state and repair the damage of the past decade. Other states are investing more in the foundations of competitiveness: education, need-based financial aid and human services. We can and should do more to boost opportunity for more Ohioans:
- Restore funding to local governments for the services all Ohioans depend on -- parks and bike paths, emergency services, libraries, clean water, safe streets, and more.
- Restore initial eligibility for childcare to 200 percent of poverty, the same threshold used by food pantries. Accept children to childcare for a full year, to line up with public pre-kindergarten opportunities. Boost funding for pre-K for three- and four-year-olds to national levels. Ensure sufficient pay for services to underpin quality in both childcare and pre-K.
- Establish a funding formula for schools that compensates for the loss in property tax and establishes a stable baseline for the future. Stop funding failing privatized schools.
- Restore funding for public colleges and universities to a level at which tuition can be frozen without harming quality. Restore need-based financial aid to pre-recession levels and allow community college students to access this aid.
- Fund human services at an adequate level. Ohio’s safety net program was underspent while poverty rates remain higher than before the recession. It is estimated 22,000 people with developmental disabilities wait for services they need immediately. We’ve committed to helping our neighbors, but if we don’t fund such services adequately, it’s an empty promise.
- Ensure Ohio’s correctional system is funded well enough to reduce violence in prisons and to have the information needed to keep track of youth and adults in the community corrections systems.
- Instead of continuing to deliver ever-larger tax cuts to a narrowing set of the richest Ohioans, provide adequate investment in services that broaden opportunity for many Ohioans.
- Provide adequate review of the $8 billion of tax breaks in Ohio’s tax code. Sunset those that are no longer needed. Use the funding to broaden opportunity for more Ohioans.
- Enact a 5 percent severance tax on oil and gas produced through fracking. Don’t use the revenues to cut income taxes more. Use them to build necessary infrastructure and provide necessary services in communities affected by drilling and to build a brighter future for more Ohioans.
 This paper describes the revenues that pay for state services in the General Revenue Fund (GRF) in the new budget, House Bill 64, which covers the fiscal years[3] that began July 1, 2015 and end June 30, 2017, and compares it with a prior budget.
Budget analysis typically focuses on the GRF. Taxpayer dollars are deposited in this account, and legislators decide how to use those resources to support education, health care, courts, colleges, universities and other important public purposes.
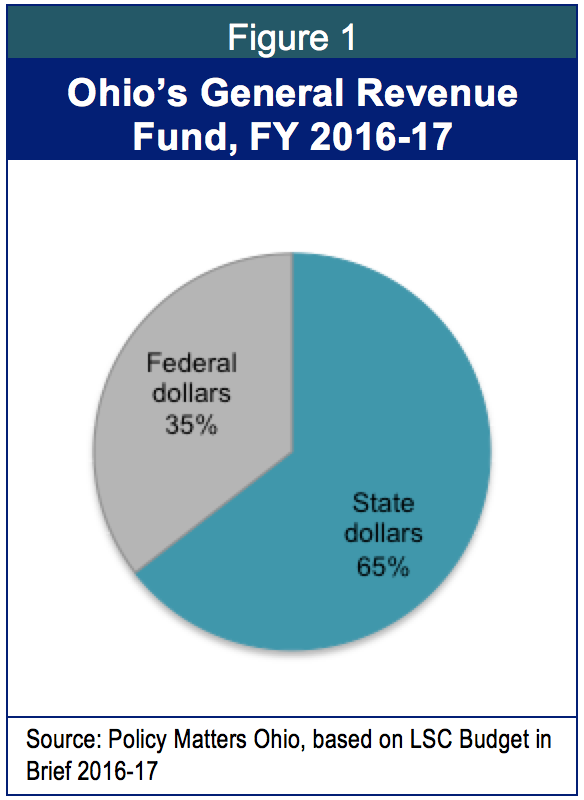
Ohio is different from most states in that we include some federal dollars in our General Revenue Fund (Figure 1). The federal government pays for about two-thirds of each Medicaid dollar spent in Ohio, and we place that money in the GRF. Federal dollars in the GRF rose to 35 percent in the 2016-17 budget from 30 percent in 2008-09. This growth is due in part to the expansion of Medicaid provided for under the Affordable Care Act, which has enabled more than 630,000 poor Ohioans to get health care and brought billions of additional federal Medicaid dollars into the state’s economy.
Figure 2 shows additional changes in the profile of revenues supporting the current budget compared to the 2008-09 budget. The personal income tax is a smaller share now than a decade ago, down to 36 percent today from 41 percent in the 2008-09 budget. The sales tax has grown to 46 percent in 2016-17, from 36 percent in 2008-09 (Figure 2).

Tax cuts and jobs
Ohio’s income tax has been cut, year after year, to bring top rates down. The cuts started in 2005 and have continued, year after year, in most years since then. The rationale has been that if income taxes are cut, jobs will grow.
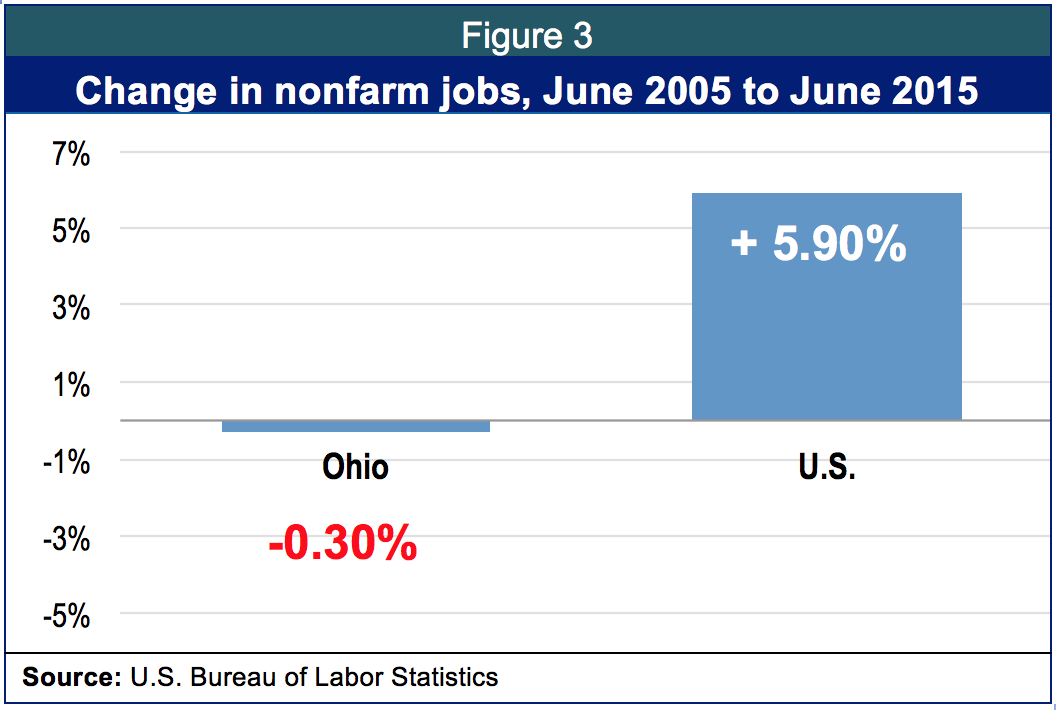
After a decade of major income-tax cuts, Ohio’s job growth lagged behind the national average. Nor have more recent tax reductions, including across-the-board income-tax rate cuts and the creation of the business-income tax break since 2013, led to relative job gains. Figure 3 shows Ohio’s very tiny employment growth compared to the national gain since June 2005.
Tax policy
Yet despite this record, the General Assembly reduced personal income tax rates and expanded a tax break for business owners in House Bill 64, the budget bill for Ohio. These new cuts, together, will drain billions of dollars in revenue over the next few years -- money that is badly needed to restore local services, put teachers back in classrooms, control tuition, and provide human services. The legislature paid for these tax cuts in part by using additional revenue the state expects based on economic growth over the next two years, and in part by raising the cigarette tax. The net result is a further shift in who pays Ohio’s taxes: The most affluent residents on average pay thousands of dollars a year less, middle-income Ohioans see tax cuts of under 39 cents a week, and some of the Ohioans who struggle most to make ends meet pay, on average, pay more than they did before.
The legislature failed to enact increases in the tax on oil and gas drilling that would have put Ohio more in line with other energy-producing states. State policy, as a result, allows precious limited natural resources to be extracted and fails to help communities that face higher infrastructure and other costs because of the drilling.[4] Nor did the General Assembly create a mechanism to regularly review the $8.5 billion a year the state gives out in annual tax exemptions, credits and deductions., known as tax expenditures. Indeed, while four retirement or senior income-tax credits were limited to those with income below $100,000, other tax breaks were expanded or created. Most significantly, despite little evidence that it creates jobs, a tax break for business owners created in 2013 was expanded substantially. Overall, the cost of such tax breaks will rise by hundreds of millions of dollars a year.
The biggest element in the tax plan is a 6.3 percent across-the-board income-tax rate cut. The expansion of an existing tax break will exempt business income starting next year up to $250,000 and tax additional business income at a 3 percent flat rate. The cigarette tax was increased by 35 cents, to $1.60 a pack. Table 1 details how the plan will affect residents at different income levels, according to an analysis for Policy Matters by the Institute on Taxation and Economic Policy (ITEP), a national research group with a sophisticated model of the state and local tax system:[5]
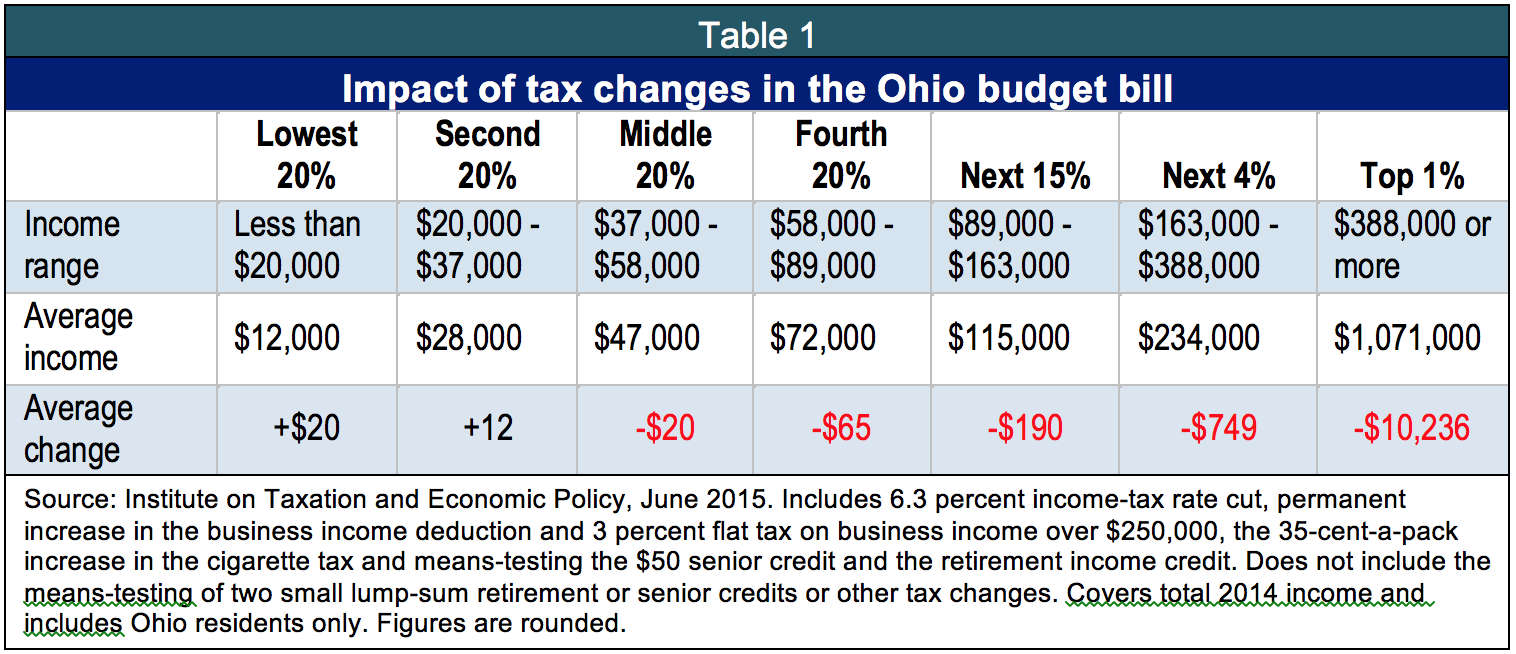
ITEP found that Ohio residents in the top 1 percent of income, who made at least $388,000 last year, will receive half of the total income-tax cuts under the bill. This group on average will see an annual net tax cut of $10,236. Ohioans who made between $37,000 and $58,000 will see an average cut of just $20. Those who made less than $20,000 last year will see an average increase of $20.
Unlike tax changes in each of the last two years, there were no special features in the tax plan specifically aimed at lowering taxes for low- and moderate-income Ohioans. The state and local tax system is skewed against less affluent residents, who pay more of their income in such taxes than the wealthy do.[6] The tax package in the budget bill continues the long-time trend of making that situation worse.[7]
The 35-cent cigarette tax increase is worthwhile because of the demonstrated improvement of higher tobacco taxes on public health. However, this increase falls most heavily on the lowest-income Ohioans. Cigarette taxes are charged per unit, not based on price, and lower-income individuals are more likely to smoke. Of course, only cigarette smokers will pay this added tax. However, even excluding the cigarette tax boost, the proposal remains highly rewarding to Ohio’s most affluent, while providing meager benefits to most Ohioans. The bottom four-fifths of Ohio residents will receive just 15 percent of the tax cuts. Even those making between $58,000 and $89,000 would only receive an average annual income-tax cut of $94.
Figure 4 shows the broad outline of tax changes in the budget bill.
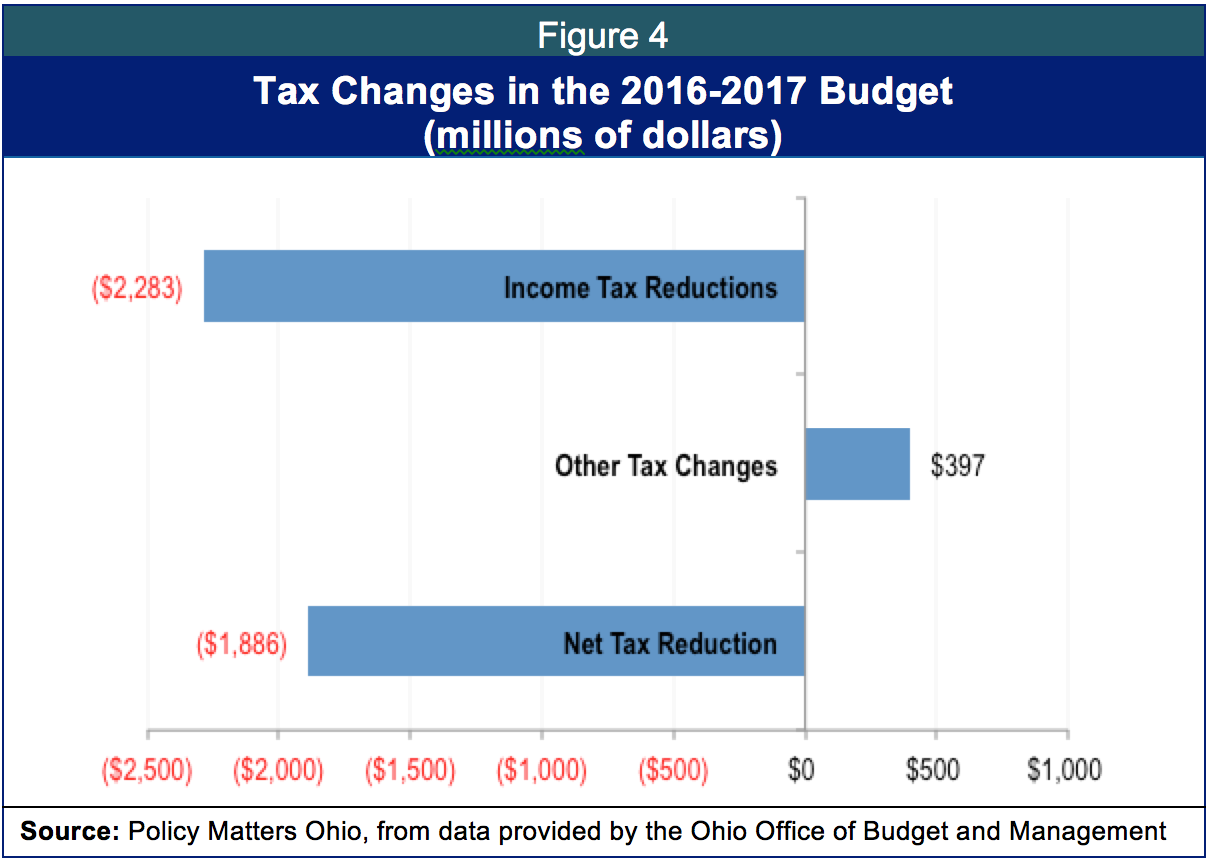
Most of the “other tax changes” are the cigarette tax increase, which accounted for $366 million. The net tax cuts of nearly $1.9 billion over two years come after a decade of tax reductions that have added up to more than $3 billion a year.
Tax breaks
The new state budget adds significantly to the $8.5 billion in tax breaks Ohio gave out this fiscal year, as counted by the Ohio Department of Taxation.[8] At the same time, the General Assembly turned down a number of proposals to limit or repeal certain existing tax exemptions and credits.[9] While some special-interest provisions included in earlier versions of the budget did not find their way into law and Governor Kasich vetoed others that the legislature had approved, this still leaves the state with more tax breaks, totaling hundreds of millions of dollars a year, than when the year began.
By far the largest new tax break in the budget is an expanded deduction for income from owners of pass-through entities – businesses such as partnerships and S Corporations, limited liability corporations and master limited partnerships – whose owners pay personal income tax on their profits. The Kasich administration estimated the cost of that expansion in Fiscal Year 2017 at $558 million.[10] The initial tax break, approved in 2013, did not produce overall job gains for the state, or a significant increase in employment at small businesses that were hiring employees for the first time. According to the U.S. Bureau of Labor Statistics, the number of employees added by such small Ohio businesses amounted to 85,856 last year – below what it was in 2012, the year before this tax break was approved, and down 28 percent from the number a decade earlier.[11] Business owners in general hire or expand when there is a growing market for their products or services, not because they have more cash in their wallets from lowered taxes. The average tax savings in 2014 from the deduction was about $1,050, with most claiming far less than that. As a result, it’s not surprising that many business owners didn’t bother claiming it at all. The taxation department spent $38,000 informing 130,000 such owners they were eligible for it but hadn’t claimed it. This tax break has not succeeded and it costs the state hundreds of millions of dollars a year in revenue needed for important public investments.
Other new or expanded tax breaks include:
- A break on the state’s main business tax for companies located in a suburban Columbus business park that are in the same supply chain making “a personal care, health, or beauty product or an aromatic product, including a candle.” This carve-out, which is retroactive, favors such companies over similar ones elsewhere, including those in Ohio.
- A sales-tax exemption covering sanitation services provided to meat slaughtering or processing operations simply because they are necessary to comply with federal meat safety regulations.
- A sales-tax exemption on rental vehicles that car dealers provide while repairing customer vehicles, if the cost of the rental vehicle is being reimbursed.
- Expansion of a local property tax break that covers fraternal organizations like the Masons and the Moose if the property is used to provide educational or health services on a nonprofit basis.

Not all of the changes in tax breaks were revenue losers. Narrowed eligibility for the retirement income credit and the $50 senior credit is expected to generate $28.4 million in the 2017 fiscal year. The legislature also overhauled the state’s rules for when sales or use tax must be collected, including a requirement that online retailers must collect tax if they use Ohio web sites to refer potential customers.
Evaluation of tax breaks
The budget also established a joint legislative committee (2020 Tax Policy Commission) to study the tax system that will review all state tax credits, and specifically the historic preservation tax credit. The state should evaluate tax credits, most of which have never been reviewed, but it should do so on a permanent basis, and look also at other exemptions in the tax code, not just credits. Though it could still be strengthened, House Bill 9, unanimously approved by the House in June, provides for such a committee.[12]
Severance tax
 The new tax study committee also has other responsibilities. It was to produce recommendations on the severance tax by October 1. Instead of a specific proposal, it released a report that outlined some elements of what should be included, suggesting that continued discussion was “prudent.”
Oil and gas prices are in a trough in 2015, but are expected to increase over the long term.[13] Ohio’s Utica shale formation is now one of eight major producing shale formations in the nation that is tracked by the United States Energy Information Administration. In October, the EIA’s “Drilling Productivity Report” reported that the Utica is one of just two major oil and gas producing shale formations in the nation where oil production and natural gas production are still growing.[14]
Development of the oil and gas industry in rural eastern Ohio has been costly to many communities. In 2014 officials from eastern Ohio testified that their communities need more than $170 million to attract state and federal funds to improve roads, increase sewer and water capacity and strengthen emergency response related to growth of drilling. They described issues in housing, public health, safety and social services. [15]
The severance tax is used in other oil and gas producing states to meet these needs as well as to boost the state’s economy after the industry leaves.
Next steps with the income tax
The 2020 Tax Policy Commission also is charged with making recommendations on how to transition to a flat 3.5 percent or 3.75 percent income tax by 2018. Most Ohioans would pay more under those proposed flat income-tax rates, which would further reward the rich.[16] Tax Commissioner Joe Testa noted at the initial meeting of the joint committee, “It’s going to be hard to come up with a rate that doesn’t create a lot of losers.” Simply put, a flat-rate income tax is not in the interests of most Ohioans.
Trends in Ohio budget policy
House Bill 64, the current budget bill, increased state-source spending but over time we are just catching up to inflation after a tough decade. Some of the most important public services funded by the state have not been restored. Ohio is serving the new needs and higher needs in the post-recession economy.
Poverty is higher in Ohio than it was before the recession. In 2014, 15.8 percent of Ohioans lived in poverty, up from 13.1 percent in 2007.[17] Ohio ranks 45th in infant mortality rate as a state and 50th in infant mortality of African American babies. [18] The Health Policy Institute of Ohio finds Ohio ranks 47th among the states in health value, which measures well-being and cost; [19] 36tth among the states in adults with a college degree[20] and 36th in access of four-year olds to pre-school enrollment.[21] Median wages remain much lower than the national average and far below previous peaks when adjusted for inflation.[22] Many struggle to pay for childcare, transportation, and housing in Ohio’s low-wage labor market. Our infrastructure is in bad shape; we have not repaired the damage of foreclosure in many neighborhoods and the quality of water is threatened in places throughout the state. The population is aging rapidly with rising needs. Employers are demanding workers with higher levels of education. Meeting the challenges of the changing economy, demographics and employer needs will take a commitment over time to a set of investments that boost opportunity for all Ohioans.
Trends in Ohio spending
Figure 5 shows the largest share of Ohio’s state-source General Revenue Funds is used for education. Primary and secondary schools and higher education, taken together, make up 52 percent of the budget. Health and human services make up another 30 percent. The remaining 7 percent supports other human services: children’s services, services for developmentally disabled, aging, public health and more. Corrections – both youth services and the Department of Rehabilitation and Corrections – make up around 7 percent. Revenue sharing with local governments makes up 3 percent.

In this section, we review trends in state investment between 2008 and 2017. We also compare the current two-year budget for 2016 and 2017 with the prior budget. We look at use of state-source funds in the General Revenue Fund, which include tax revenues and lottery profits (for education), but exclude the federal revenues Ohio puts in the GRF. Long-term analysis is adjusted for inflation so we can make an apples-to-apples comparison. Short-term analysis -- the current budget compared to the prior budget -- is not adjusted for inflation. As stated, we use state fiscal years, which run from July 1 to June 30, unless otherwise noted. Historical figures for 2008-2015 generally represent actual expenditures taken from the Ohio Legislative Service Commission’s historical state-source expenditures table (Table 1), unless otherwise noted. Figures for 2016 and 2017 represent appropriations and are generally from the same source.
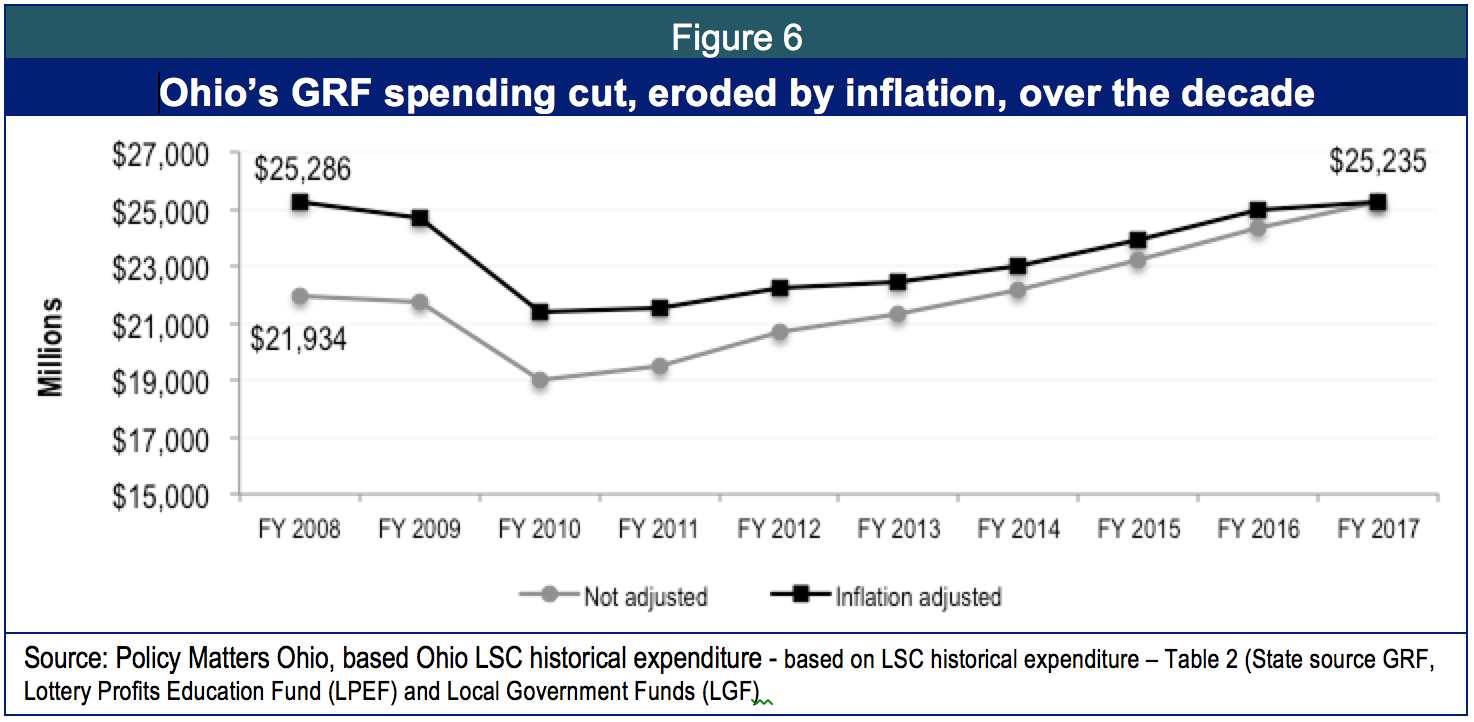
Between 2008 and 2017, Ohio weathered recession and recovery. There were cuts and restorations. Figure 6 shows how by 2017, state spending will be restored to the level of a decade earlier on an inflation-adjusted basis. It also highlights how the erosion of inflation compounded deep cuts in the years between 2008 and 2017.
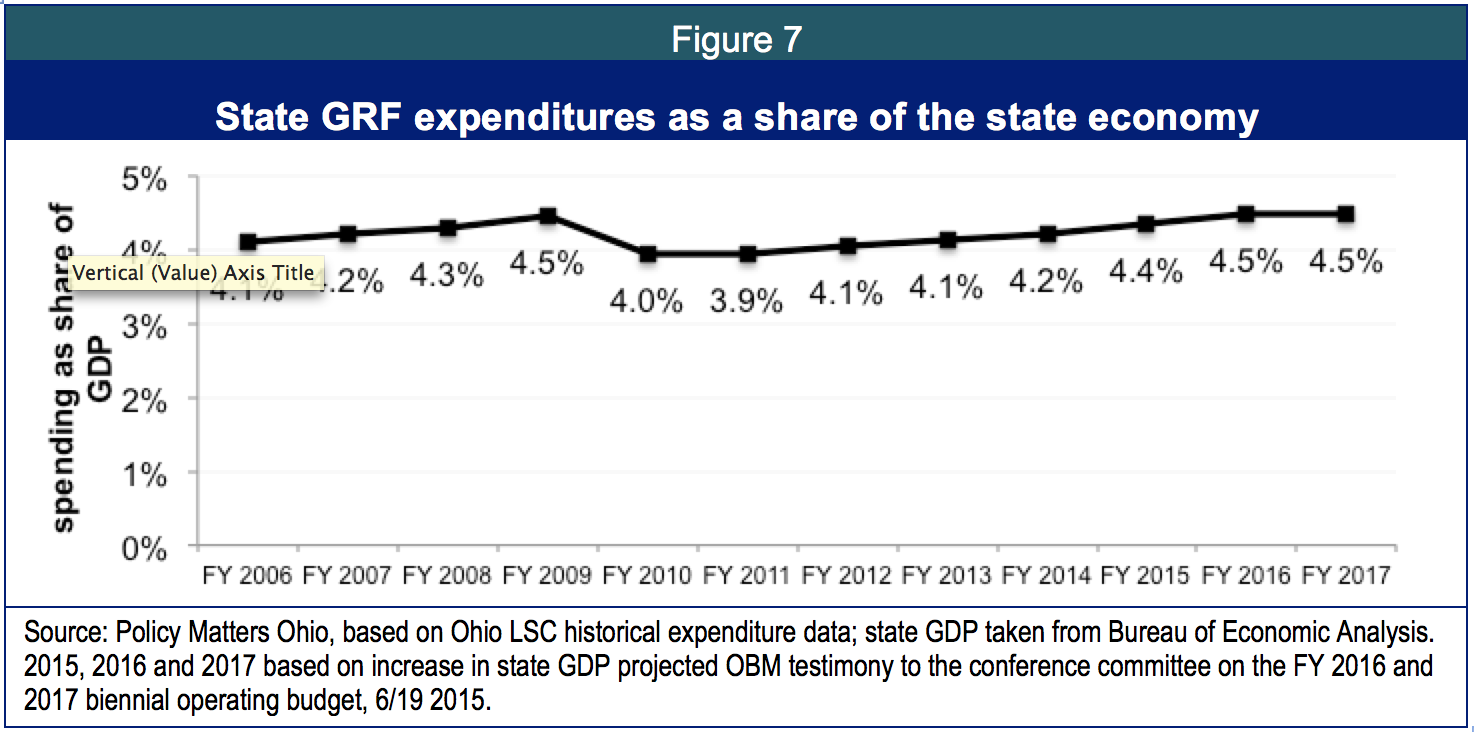
Ohio’s budget fell more than other states during the recession and immediately afterwards.[23] After the recession the state’s economy grew, but state spending plummeted. Figure 7, which shows state spending as a share of the state gross domestic product, illustrates a similar pattern.
 Not adjusted for inflation, House Bill 64 increased state-source spending by $4.2 billion, an increase of 9.3 percent. The Kasich administration has made good investments in some key areas in the budget for 2016-17, such as health care. But tax cuts that overwhelmingly benefitted the wealthiest were prioritized over other critical needs, like childcare, need-based financial aid and revenue sharing with Ohio’s communities.
State revenue sharing with local government
The state ended last fiscal year in good shape, with an ending balance of just over $1.7 billion. The funds were used to meet required carryover, for outstanding commitments, for the budget stabilization fund and for other one-time uses. The rainy day fund, known as the budget stabilization fund, now has $2 billion dollars.[24] The state’s stable fiscal condition and ability to make enormous tax cuts were made possible in significant measure by cuts to local government.
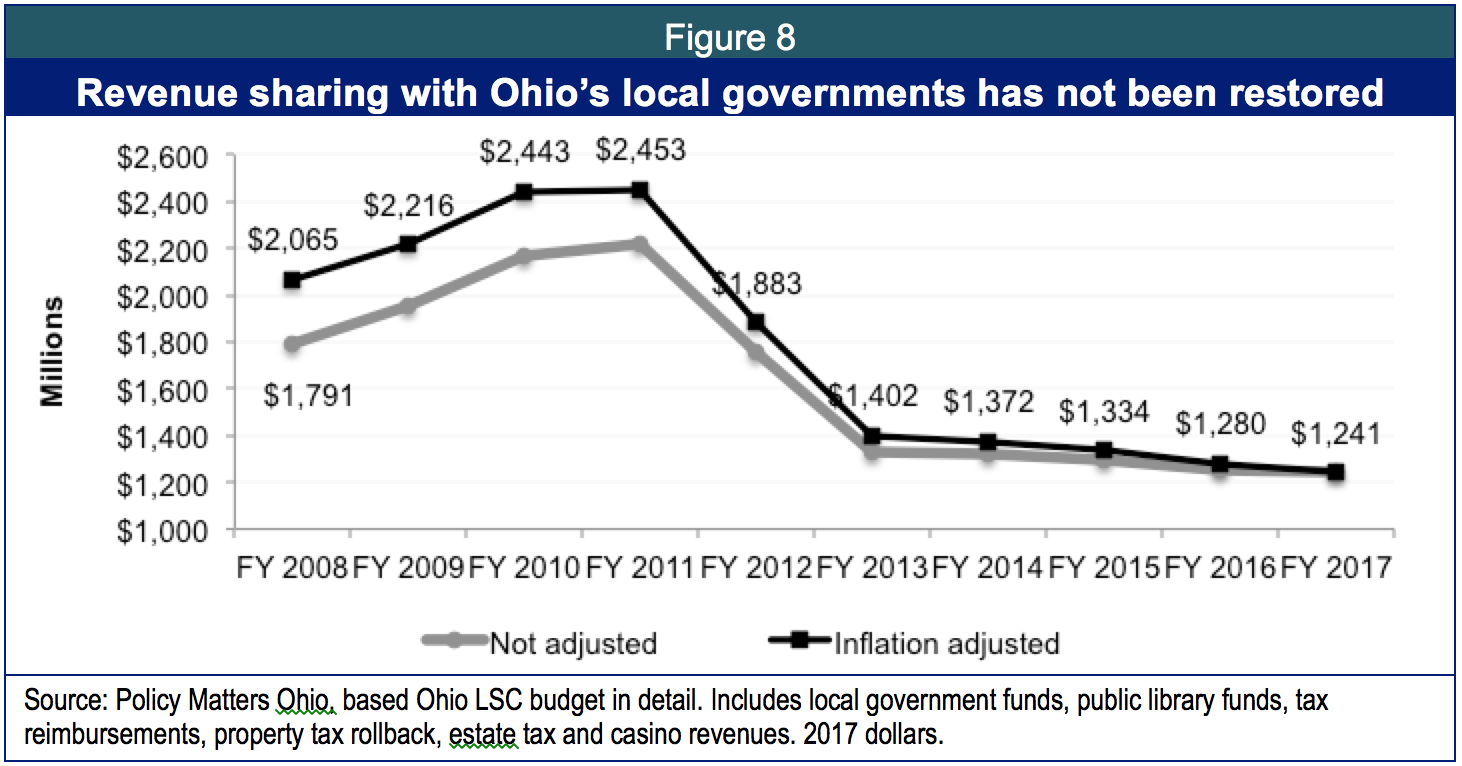
Revenue sharing has been dramatically reduced since the first budget of the Kasich administration for 2012 and 2013. The Local Government Fund has been cut in half. The property tax “rollback” – state-funded property tax relief on residential properties -- has been eliminated for new levies. Tax reimbursements have been largely phased out. The estate tax was eliminated. New revenues from casino gambling have not begun to make up for the loss of these other sources.
Figure 8 shows the inflation-adjusted trend in revenue sharing with local governments. In 2017, local governments will get $824 million less (adjusted for inflation) than in 2008. During the two-year span of the 2016-17 budget, local governments will receive $1.76 billion less, inflation-adjusted, than they did in 2008-09, a cut of 41 percent.
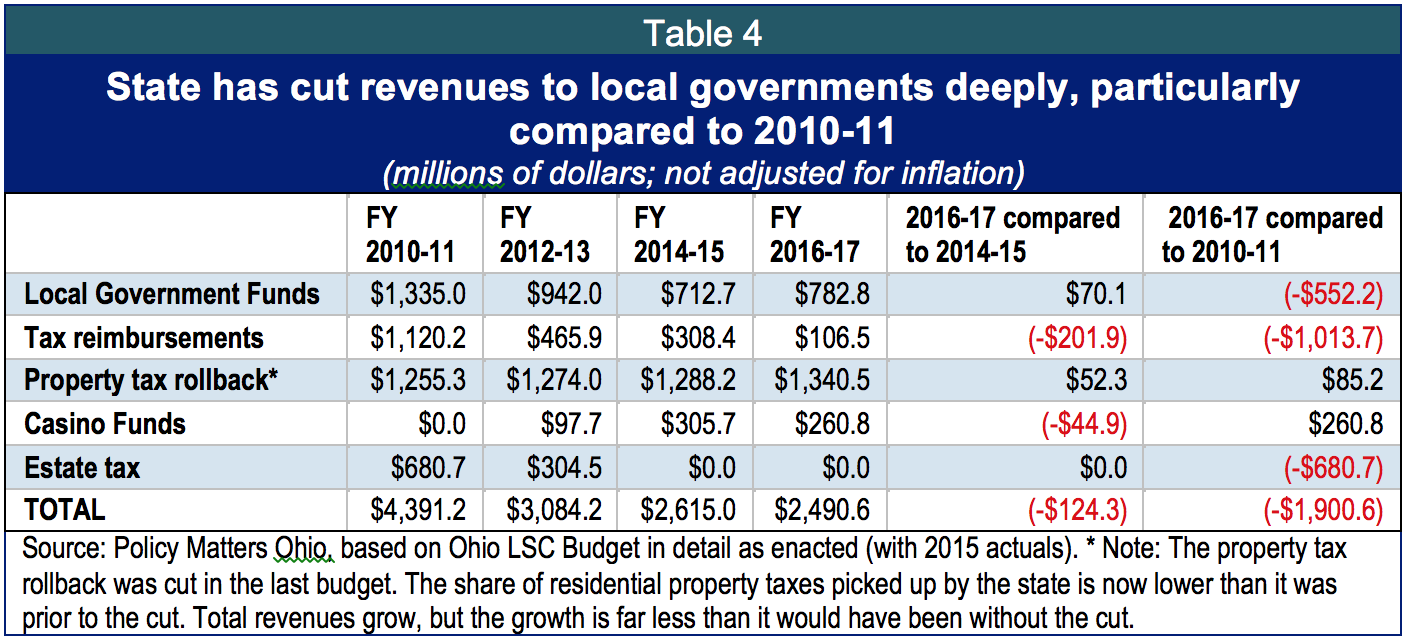
Cuts to local government deepen in the new budget. The 2016-17 budget provides $124.3 million less than the prior budget (not adjusted for inflation) to counties and municipalities, as well as to levies for fire districts, mental health boards, aging and other local services.[25] Table 4 shows cuts since the 2010-11 budget, the last budget period in which the historical public finance partnership between Ohio’s state and local governments was held harmless. The loss is $1.9 million, even without adjusting for inflation.
In addition to the $124.3 million reduction in funding, the current budget diverts $39 million in local government funds from cities and large villages to townships and small villages and earmarks funds for specific uses. This does not add to the $124.3 million cut, but it helps some (townships and small villages) and hurts others (cities and larger villages).
- Townships get a new distribution of $20 million that will be diverted from the municipal portion of the Local Government Fund, which supports municipalities with an income tax.[26]
- Small villages with less than 1,000 residents get a new distribution of $2 million.
- Municipalities larger than 1,000 in population lose $22 million from these diversions.
- Another $15 million is diverted from Local Government Funds – which provide revenue sharing to counties, municipalities and townships, to the Law Enforcement Assistance Program, which offers training to employees from different levels of state and local government, not just local government forces.[27]
Education
Education is the single largest use of state-source funds in the budget. All levels of education were deeply cut in the 2012-13 budget. The 2014-15 budget restored some losses and the new budget continues this restoration. Across all levels of education, however, there has been a fiscal rollercoaster of cuts and restoration, which makes it difficult for administrators to plan and hire effectively. We need more certainty throughout our educational system to ensure employers will have the workforce they need now and in the future.
Early education and public childcare
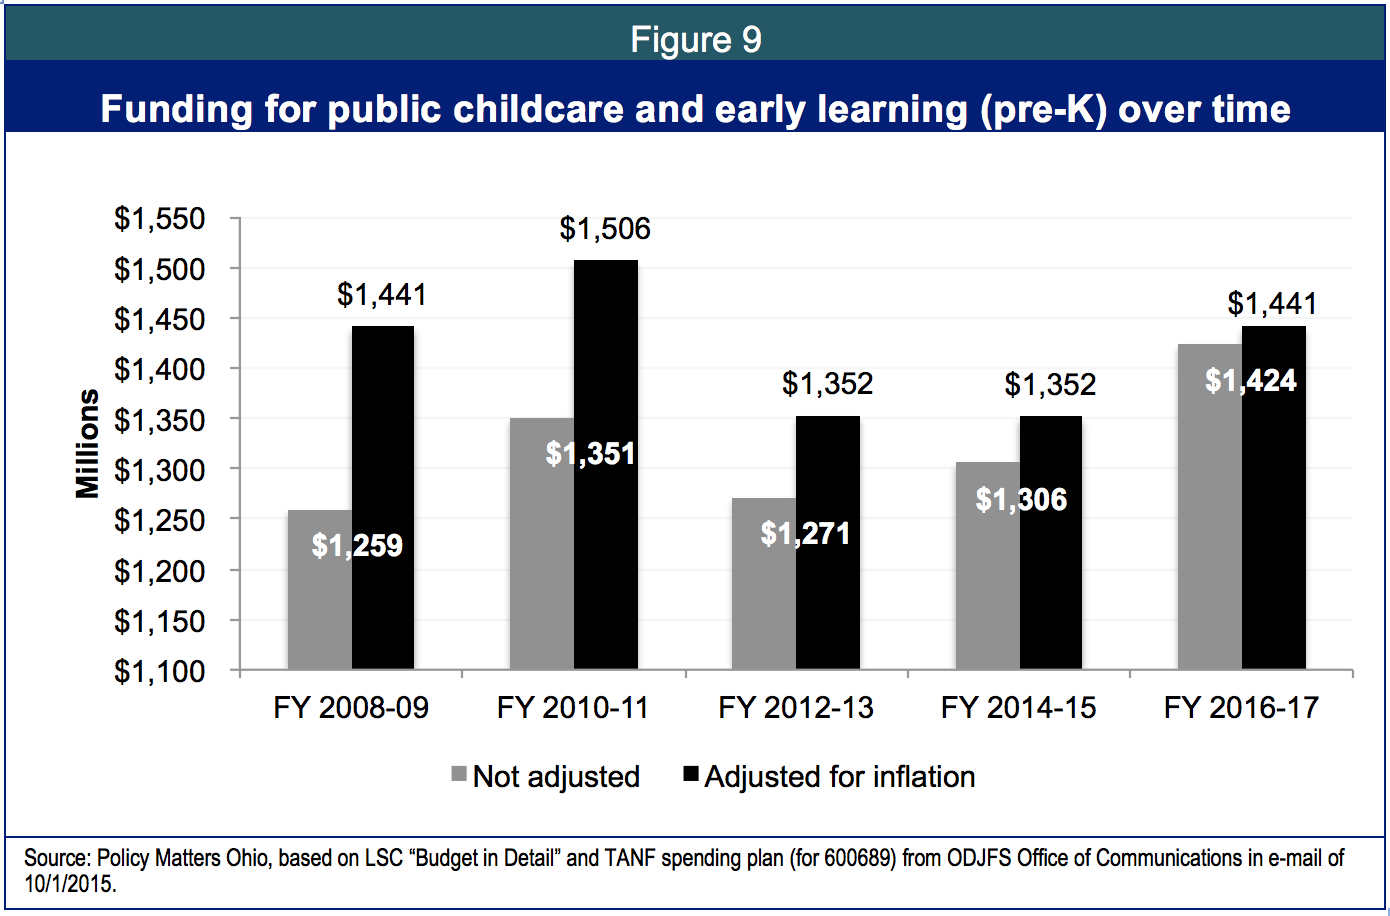
According to data provided by the Ohio Department of Job and Family Services, funding for early learning pre-kindergarten and public childcare, together, grows by $118.3 million (not adjusted for inflation) in the 2016-17 budget over the two-year budget period of 2014-15.[29] Ohio’s investment in this area rose and fell since 2008, but adjusted for inflation, we will be spending the same amount of money in the current two-year budget period as we did during the 2008-09 budget of the recession.. (Figure 9). Our investment has fallen since 2010-11.
Ohio has a split system of early care and education. Public childcare, a work support program, is funded by the federal childcare block grant and from the federal Temporary Aid for Needy Families (TANF) program. Total funding is $1.28 billion over the two-year budget period for 2016 and 2017. Early learning and education is a much smaller program, funded in the budget for 2016-17 at about $161 million. These two sets of programs are administered by different agencies and have different eligibility rules and tracking systems. Yet they should seamlessly serve the same population, preparing young children from low-income families for school while helping parents gain traction in the labor market.
Early learning and pre-K
The Department of Education’s early learning program provides public pre-kindergarten for children of families with income of less than 200 percent of the federal poverty level. Early education matters, and is supported on a bipartisan basis, because of its role in preparing kids for success in school and work, which builds a strong, competitive workforce for the future. Ohio’s investment in early learning and pre-K fell, adjusted for inflation, between the 2008-09 and the 2014-15 budget before rising sharply in the current budget (Figure 10).

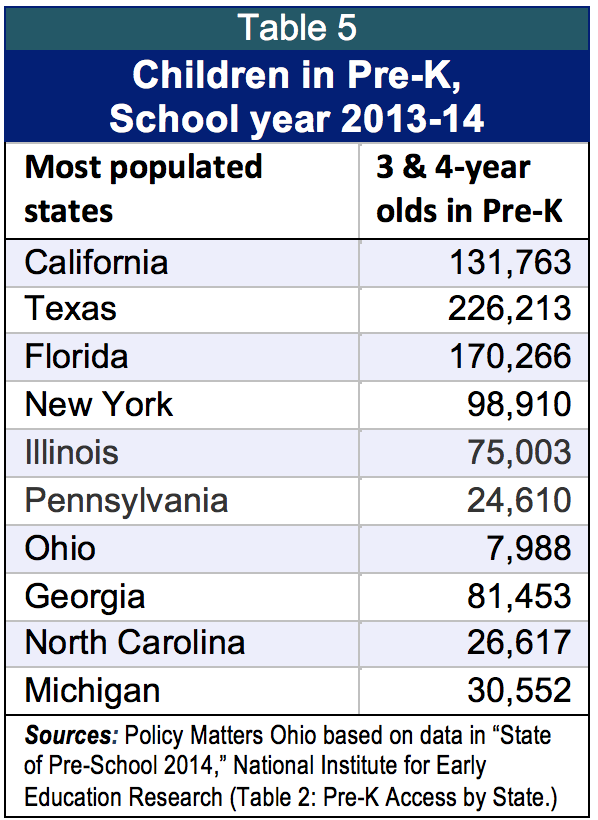 Our investment in early learning has been declining for years. Between 2001-02 and 2013-14, Ohio had the largest decline in the nation for four-year-olds enrolled in public pre-K among the 40 states (and the District of Columbia) that have such programs. Our expenditure per-child dropped by 50 percent. Even with the new investment of the 2016-17 budget, enrollment is very small compared to other large states (Table 5). [30]
Public childcare
Public childcare is mostly funded by the federal dollars. Public childcare is typically considered a human service because it helps low-income parents pay for childcare so they can work. Ohio serves more children in the public childcare program than a decade ago,[31] but spends less. The 2016-17 budget turns the trend in the right direction an increase of 4 percent -- $48.6 million -- compared to the prior budget period. However, that funding is actually 4.3 percent less in inflation-adjusted dollars -- $57 million less -- than was invested in childcare in the 2008-09 budget period. (Figure 11).
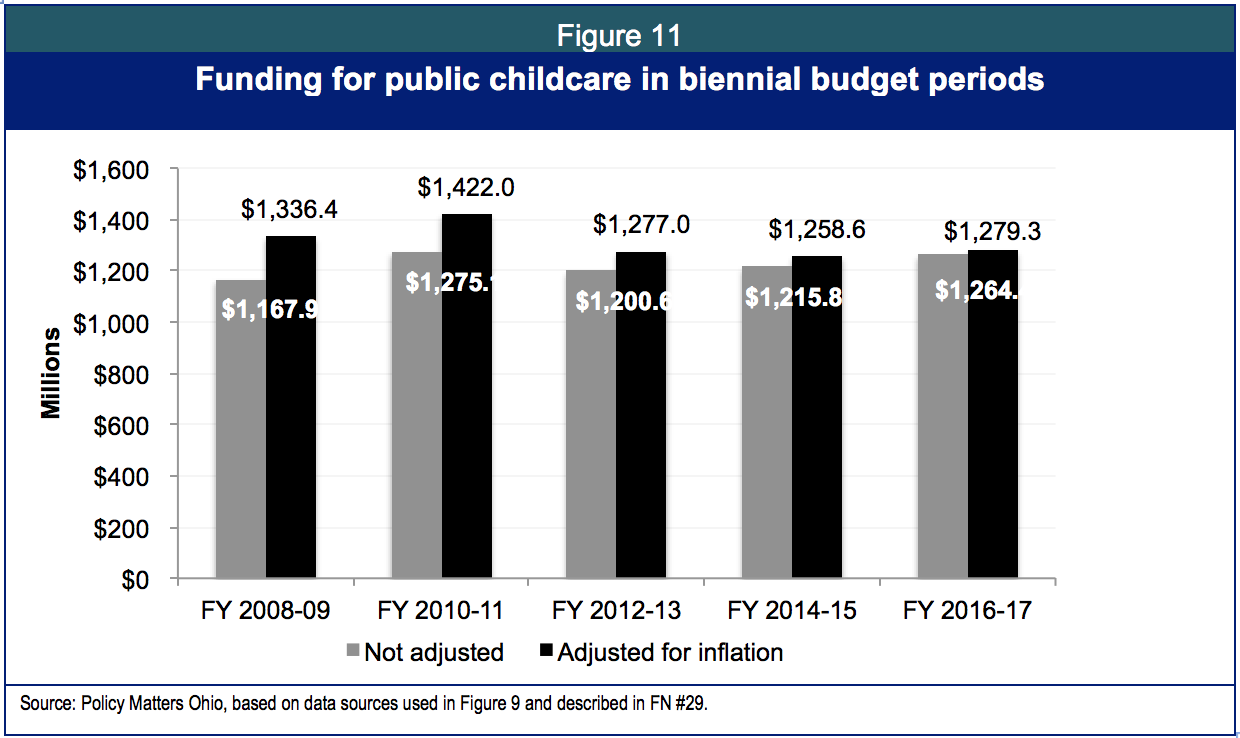
The number of students has increased over the past decade while reimbursement to childcare providers has fallen.[32] Programs to encourage quality have shown little success because of inadequate funding. [33] The 2016-17 budget will support improvements in quality, as well as:
- Eliminate co-pays required of families earning less than the federal poverty level ($20,090 for a family of three).
- Smooth out of the childcare “cliff. ” Those who enter the program at the initial eligibility level will be able to remain enrolled until they reach an income that allows them to be self-sufficient (For a family with two small children, this is about $60,000). This is a positive initiative, but small. Because of the churning low-wage labor market and parents’ difficulty in remaining enrolled, few make it to the “cliff.” In 2014, less than 2 percent of program participants tracked for separation left because they earned too much money.
- Initial eligibility for childcare aid will rise from 125 percent of poverty (about $25,112 a year for a parent with two kids) to 130 percent of poverty (about $26,117). This means that a family earning $26,118 makes too much to be eligible, although if they entered the program at the lower rate they can stay in as earnings rise. The change boosts Ohio’s ranking among the states from the third-lowest level of initial eligibility to about ninth lowest – headed in the right direction, but still in the bottom ten.
HB 64 requires the Department of Education to synchronize early childhood education eligibility, application, tracking, and payments with the public childcare program of the Ohio Department of Job and Family Services.[34] The budget, however, does not provide funding for two critical alignment measures: raising initial eligibility in public childcare to 200 percent of poverty and providing continuous, 12-month eligibility.
Primary and secondary education
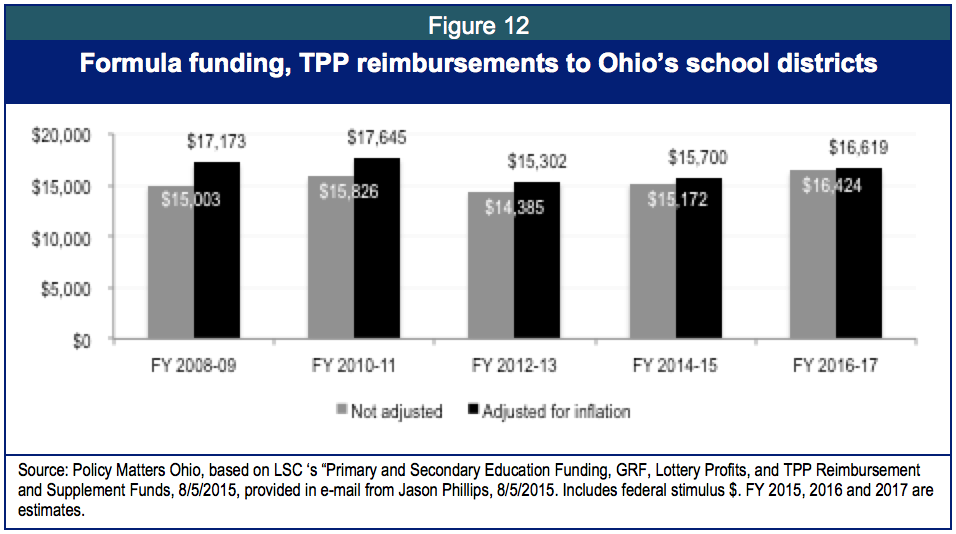
Ohio’s spending on K-12 education has not been fully restored. Formula funding in the 2016-17 budget remains $552 million below the 2008-09 budget, a decline of 3.2 percent in inflation-adjusted dollars.[35] Total state-source funding for school services, including transportation,[36] falls short of catching up to inflation: It will be $285 million or 1.3 percent below expenditures in this two-year budget period compared to the biennial 2008-09 budget.
Figure 12 shows that the 2016-17 budget boosted investment significantly compared to the prior budget. The basic state support that goes to school districts – formula funding[37] – rose by $1.25 billion compared to the 2014-15 budget, an increase of 8.2 percent (not adjusted for inflation). Total funding rose by $1.5 billion, also not adjusted for inflation, an increase of 7.7 percent.[38] Yet even this significant increase did not fully restore school funding on an inflation-adjusted basis.
The impact of state budget policy varies across the districts. Rise and fall in state aid has been compounded by loss of tax reimbursements, change in enrollment and local prevalence of charter schools and use of vouchers.
Tax reimbursements were for loss of local taxes on business and utility “personal property” (machinery and equipment, furniture and fixtures, and inventory). Some districts had more factories, warehouses or utility plants than others. For these districts, loss of tax reimbursements hit hard.
Ohio’s charter schools, which serve only about 7.2 percent of the primary and secondary students in the state, get about a billion dollars in state funding each year.[39] Ohio’s charter school industry has problems with quality and accountability.[40] National and local analysts and reporters have called Ohio’s charter system a joke and named it the worst in the country.[41] The legislature has responded with new accountability standards, which are being implemented.
House Bill 46 expands privatization of K-12 education through growing availability of vouchers, which allow students to move to private schools or alternative public schools and take funding with them. The “EdChoice” voucher program is expanded in the budget to families with incomes below 200 percent of poverty level to all districts of the state, regardless of school performance, significantly broadening the scope of the program.
Rise and fall of state aid, changes in formula funding and public systems’ loss of state resources to charters and vouchers prevent many schools from restoring cuts made in 2012-13 or planning investments for the future. Local resources cannot make up the difference. The value of taxable property in Ohio has not yet regained its pre-recession level,[42] so raising funds locally is tough in many communities. Raising local funds is made harder by the phase-out of the state share of residential property taxes (the property tax “rollback”). In the face of uncertainty, some districts have institutionalized harsh policies like pay-to-play, fewer course offerings or enlarged class size.[43] Ohio needs a commitment to adequate, stable funding for the long run. This will boost opportunity for children and assure employers a stronger workforce now and in the future.
Higher education
A skilled workforce is one essential component of a prosperous and inclusive state economy. Attaining a degree or other post-secondary credential has obvious benefits to graduates and their families. Higher education insulates against unemployment and can be a pathway out of the low-wage economy.[44] Funding for higher education is correlated with increases in productivity, increased wages and a more adaptable labor force for employers.[45]
At the height of the recession, the state cut support for public higher education institutions and drastically cut need-based financial aid. Even though the state has made some strides in holding down rising tuition and fees, Ohio remains one of the priciest states for both four-year and two-year public schools.[46] Not surprisingly, the state also has very high levels of student debt. In the 2016-17 budget, Ohio made progress toward reinvesting in higher education, but it is not enough to close the gap.
Our GRF investment in higher education has been reduced since 2008. Funding for the 2016-17 budget is $1.18 billion less than in the 2008-09 budget (adjusted for inflation) -- about 19 percent lower. Figure 13 shows the reduction over the 10 years of 2008-2017.

The 2016-17 state-source GRF budget for higher education increases by $369 million dollars over the 2014-15 budget (not adjusted), an increase of 7.8 percent. This turns the trend in the right direction, but there is a long way to go, particularly in areas that directly impact the cost of college to Ohio families, like the “State Share of Instruction,” which funds classroom teaching and operations, and need-based financial aid, which helps students from families of modest income go to college.
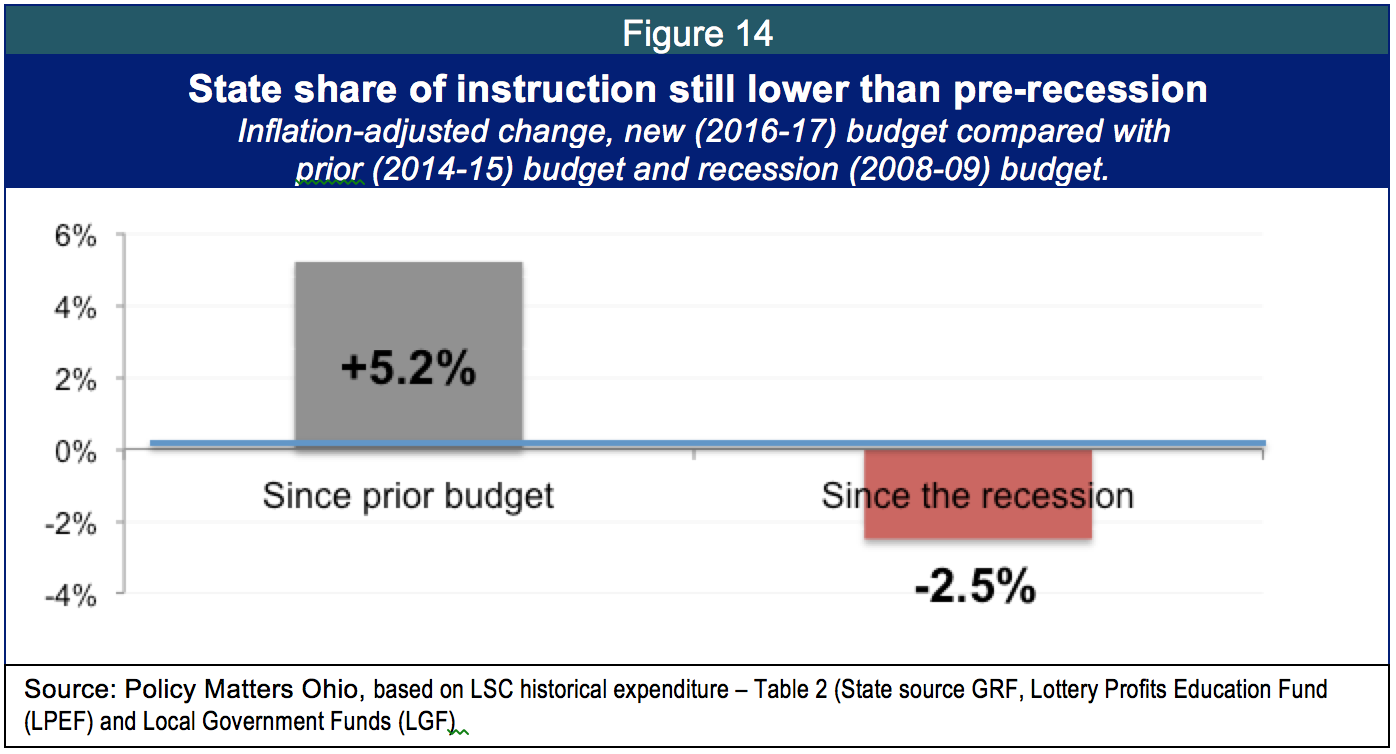
Using inflation-adjusted dollars, Figure 14 shows how funding for the State Share of Instruction has changed relative to the prior two-year budget and relative to the 2008-09 budget. Spending has increased significantly compared to the 2014-15 budget, but remains below the level of the 2008-09.
The state must reduce the cost of higher education so more students can access and complete degrees. Affordability is a make or break issue for students, both in terms of enrollment and persistence. The latest budget enacted a tuition freeze, holding tuition to 2015 levels for 2016 and 2017.[47] The budget bill also established review committees to find campus efficiencies and incentives for cutting costs and bringing down tuition. Institutions are mandated to submit plans decreasing the cost of completing a degree by 5 percent.
A new report on higher education efficiency suggests reducing hours needed to complete a degree, increasing online courses, and creating “fast-track” programs.[48] This approach often overlooks complicated drivers of cost like increases in administration and administration expense.[49] Ultimately, this approach does little to reverse the cost shift: It does nothing to rebalance the cost of higher education between the two parties that benefit, the state and the student. As state direct support to higher education and financial aid dwindled, cost shifted to students. Chancellor John Carey addressed this in his budget letter:
“If we are serious about holding down the cost of higher education, the state needs to do its share and continue to provide state support to our public colleges and universities to make education more affordable.”[50]
Funding for need-based financial aid in the 2016-17 budget is $309 million less (adjusted for inflation) than in the 2008-09 budget, despite a robust 15 percent increase in the 2016-17 budget (Figure 15).
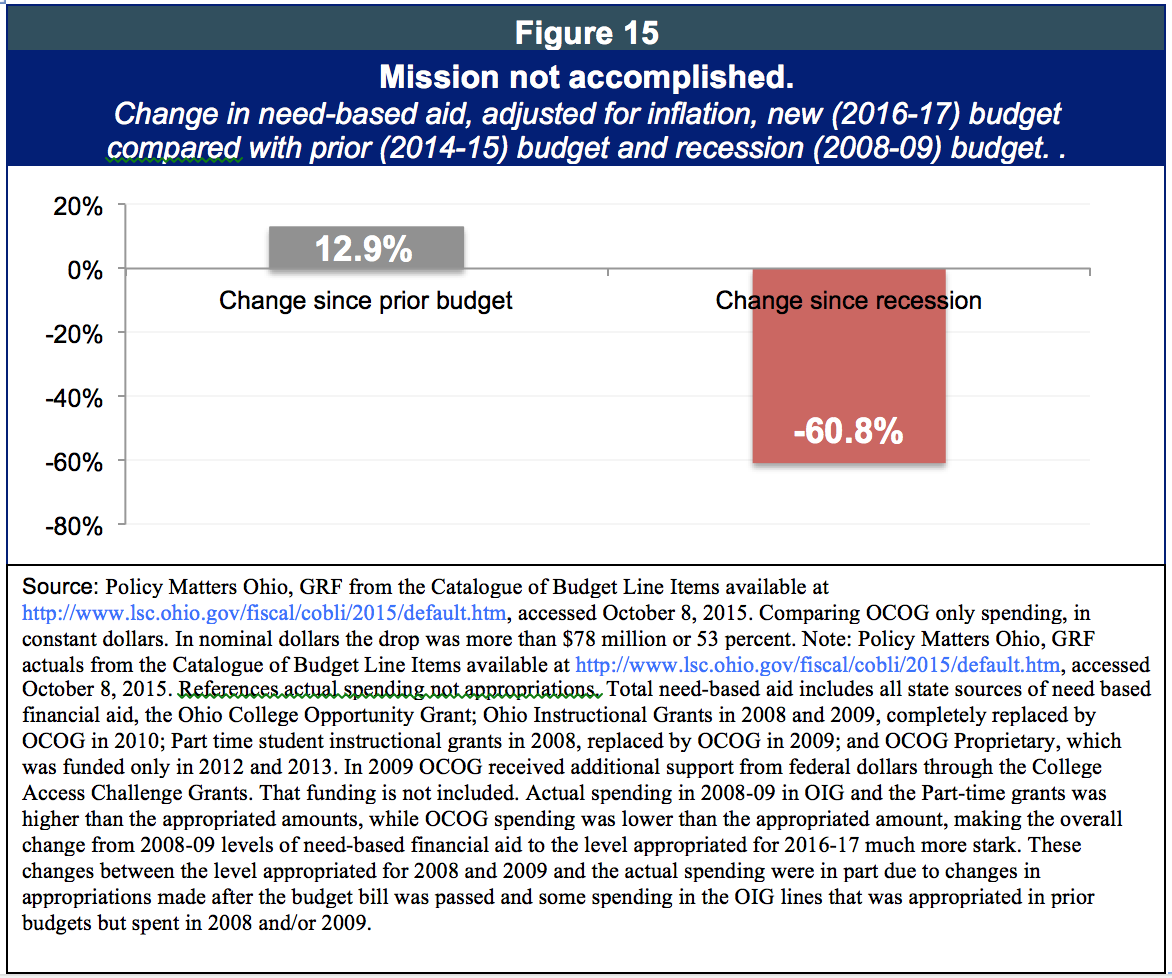
The biennial budget increases state support for higher education and financial aid, but not enough. Ohio is still below pre-recession levels for both. Ohio has a world-class network of public universities, community colleges and branch campus institutions. Underfunding this public system and keeping financial aid low hampers long-term prosperity for workers and our state as a whole.
Health and human services
The Health Policy Institute of Ohio’s recently completed “dashboard” of health indicators ranks Ohio 47th among states in health value, which incorporates both the health of the people and the cost of the services.[51] There is much Ohio’s General Assembly can do to make Ohio’s people healthier. In this section we look at selected health and human service policies in the new state budget.
In the 10 years between 2008 and 2017, and over the five, two-year budgets during that time span, expenditures for health and human services bounced up and down but on average, across the decade, rose by 1.6 percent a year in inflation-adjusted dollars (Figure 16). This largely reflects investment in health through the Medicaid program.

Medicaid
The largest share of the Department of Medicaid budget comes from the federal government, which pays between about 63 and 100 percent of each Medicaid dollar in Ohio.[52] Medicaid is also supported by special taxes and fees related to the health care industry.
Medicaid caseload grew by an average of 8 percent annually between 2008 and 2015, driven by growth of more than 20 percent in 2014, with Medicaid expansion. State-source spending for Medicaid between 2008 and 2017 will grow by an annual average of about 3.3 percent a year, adjusted for inflation and will be $2.2 billion more in the 2016-17 budget than in the 2008-09 budget. Growth of state spending has been slower than growth of caseload because the federal government pays all of the costs of recent non-elderly adults without disabilities enrolled under the Medicaid expansion of the Affordable Care Act.
State-source spending for Medicaid rises in the 2016-17 budget by $740 million, not adjusted for inflation. This is an increase of 7.7 percent over the prior two-year budget. Medicaid has grown, but the overall budget has also expanded. According to the Legislative Service Commission’s historical expenditure data, state-source Medicaid spending continues to account for about 21 percent of state source spending in the GRF for 2016-17, as it has since 2012.
In September 2015 Medicaid provided health care to over 3 million Ohioans, more than a quarter of the state’s population. Ohio’s Medicaid program serves 1.4 million children, from birth to age 18 (51 percent of all Ohio children under age five), 200,000 senior citizens, 51,000 individuals residing in nursing facilities; and 95,000 individuals in home and community-based settings.[53] The remainder, somewhere over 1 million, are adults who are enrolled through the Medicaid expansion or who were eligible prior to the expansion because they are parents earning less than 90 percent of the federal poverty level.
The expansion of Medicaid has been successful in Ohio. More than 630,000 people who were not insured and could not see a doctor may now seek preventative care. As more people take control of common chronic and debilitating diseases like diabetes, rising health care costs are expected to moderate. Ohio’s hospitals have seen strengthened bottom lines as people seek preventative care through doctors.[54] The new budget bill would change this, directing the administration raise costs, impose penalties and cap care for adults covered by Medicaid. Studies have found charging even low fees or imposing premiums reduces participation.[55]
The federal government may not accept the changes mandated by the legislature. Close scrutiny of the program may find it fails to meet the goals of the federal program because it proves to be expensive (charging fees does not raise very much money) and because it has been found in studies to cause people to drop out.[56]
Human services
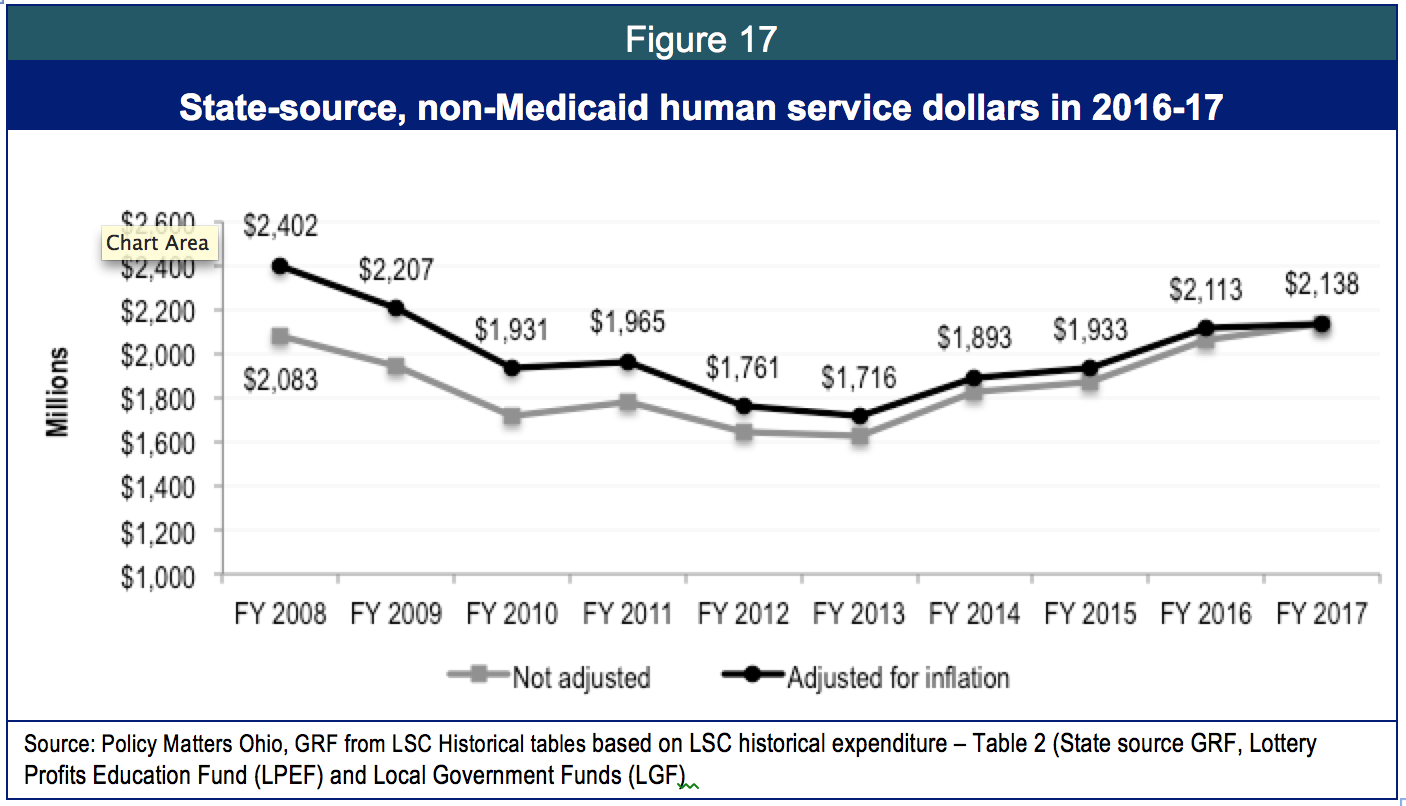
State-source funding for human services other than Medicaid (such as services for families, seniors and children, adoption, cash assistance, food aid and others) declined over the decade (Figure 17) and has not kept up with inflation over time. By 2017, state funding for non-Medicaid human services will be, on an inflation-adjusted basis, $263 million dollars less than in 2008, a drop of 11 percent.
The decline in state funding of human services has been going on for a long time. Figure 18 shows that state funding for non-Medicated human services in 2017 will be $426 million lower than in 2001, although the poverty rate in 2000 was a third less than it is now (10.1 percent in 2000 compared to 15.8 percent of the population in 2014).
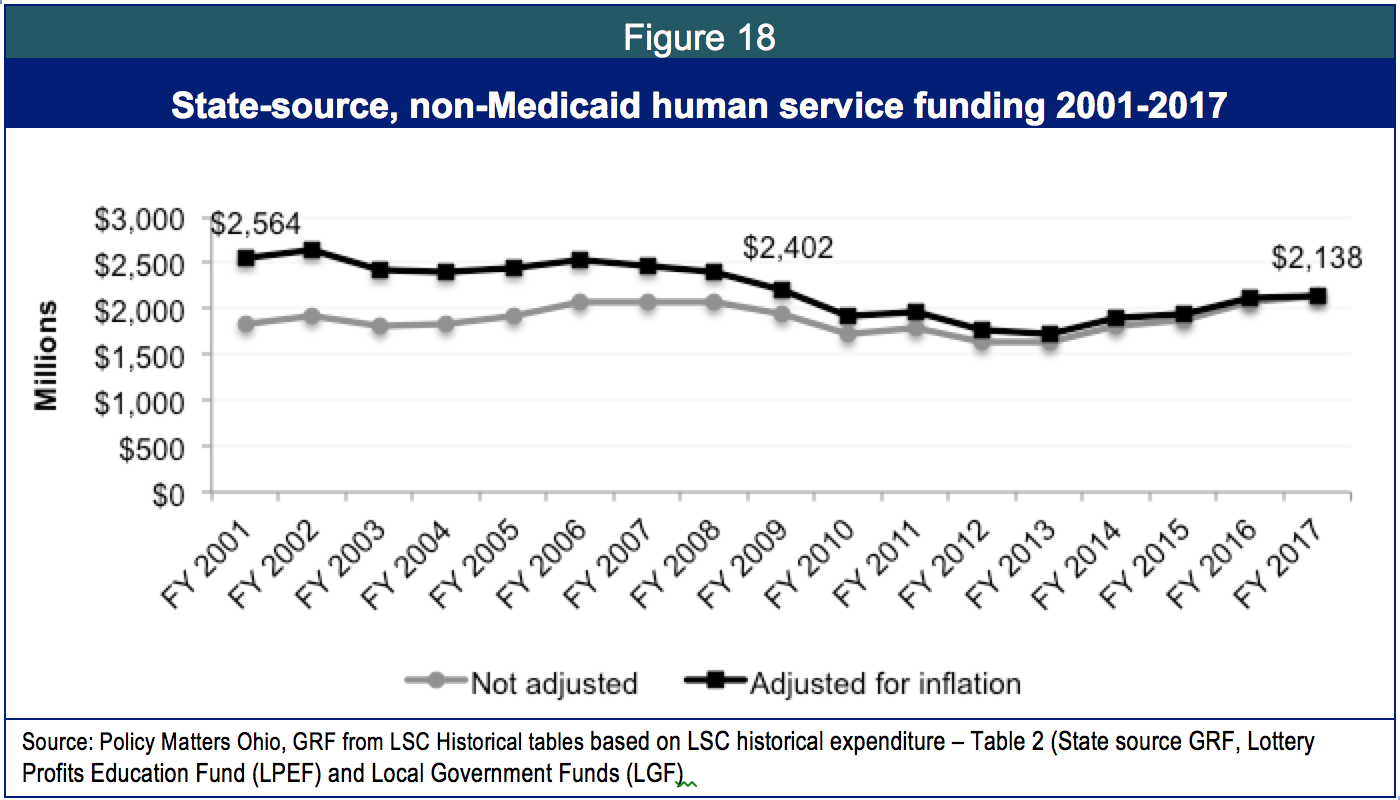
Figure 19 compares funding levels in the prior budget to the current one and illustrates relative size of state-source investment in Ohio’s six ‘sister’ human service agencies. While funding for some agencies looks very small, Figure 19 just shows state-source funds. Federal dollars fund the lion’s share of expenditures by human service agencies. This highlights the importance of what happens in Congress to health and human services that support and protect Ohio families.

Across human services, non-Medicaid, state-source spending in the GRF increases by $380 million -- not adjusted for inflation -- or 10.8 percent in the budget for 2016-17.
- The Department of Developmental Disabilities (DODD) gets new funds to serve people in their homes instead of institutions. Non-Medicaid GRF spending increases by $176 million or 16.7 percent. A recent survey indicates 22,000 Ohioans with developmental disabilities need help with the activities of daily living and health care. This budget provides new money so more can get help to live at home and get help form home-care workers. Unfortunately, the home-care workforce so poorly paid that turnover is high, hurting the quality of services; many workers rely on public assistance. The Kasich administration stripped this workforce of rights to bargain collectively. The state is promising it will live up to its promises but the program it is creating is not sustainable.
- The Ohio Department of Job and Family Services (ODJFS): GRF appropriations rise by 8.3 percent, an increase of $123.8 million. Much of the increase is due to technical changes in accounting.
- The Department of Mental Health and Addiction Services (MHAS): GRF appropriations in the new budget will rise 9 percent over the prior budget, an increase of $64.7 million. The GRF budget for this agency is characterized by significant shifts in priorities and funding.
- The Department of Health sees funding rise by $12.8 million or 7.3 percent.
- The Department of Aging sees funding rise in 2016-17 by $1.6 million, a 5.4 percent boost. Additional funding through the Ohio Department of Job and Family Services will provide funding for counties to provide adult protective services on a wider scale than at any time in the past 20 years. However, funding provided is a small fraction of what advocates say is needed, and undercut by state cuts to local senior levies. While the state moves aggressively to allow seniors to stay in their homes and get assistance they may need through home health workers, this workforce is so poorly paid that turnover is very high, hurting quality of service, and the state eliminated their right to bargain collectively for better wages. An unsustainable model is being created, balanced on the back of a struggling workforce.
- The Department known as ‘Opportunities for Ohioans with Disabilities’ (The former Rehabilitation Services Commission) will get an increase of $1.1 million dollars or 3.5 percent over the prior budget. A significant increase in federal and other funds push overall appropriations $44 million above last year’s expenditures, a 10.1 percent increase.
Temporary Assistance for Needy Families
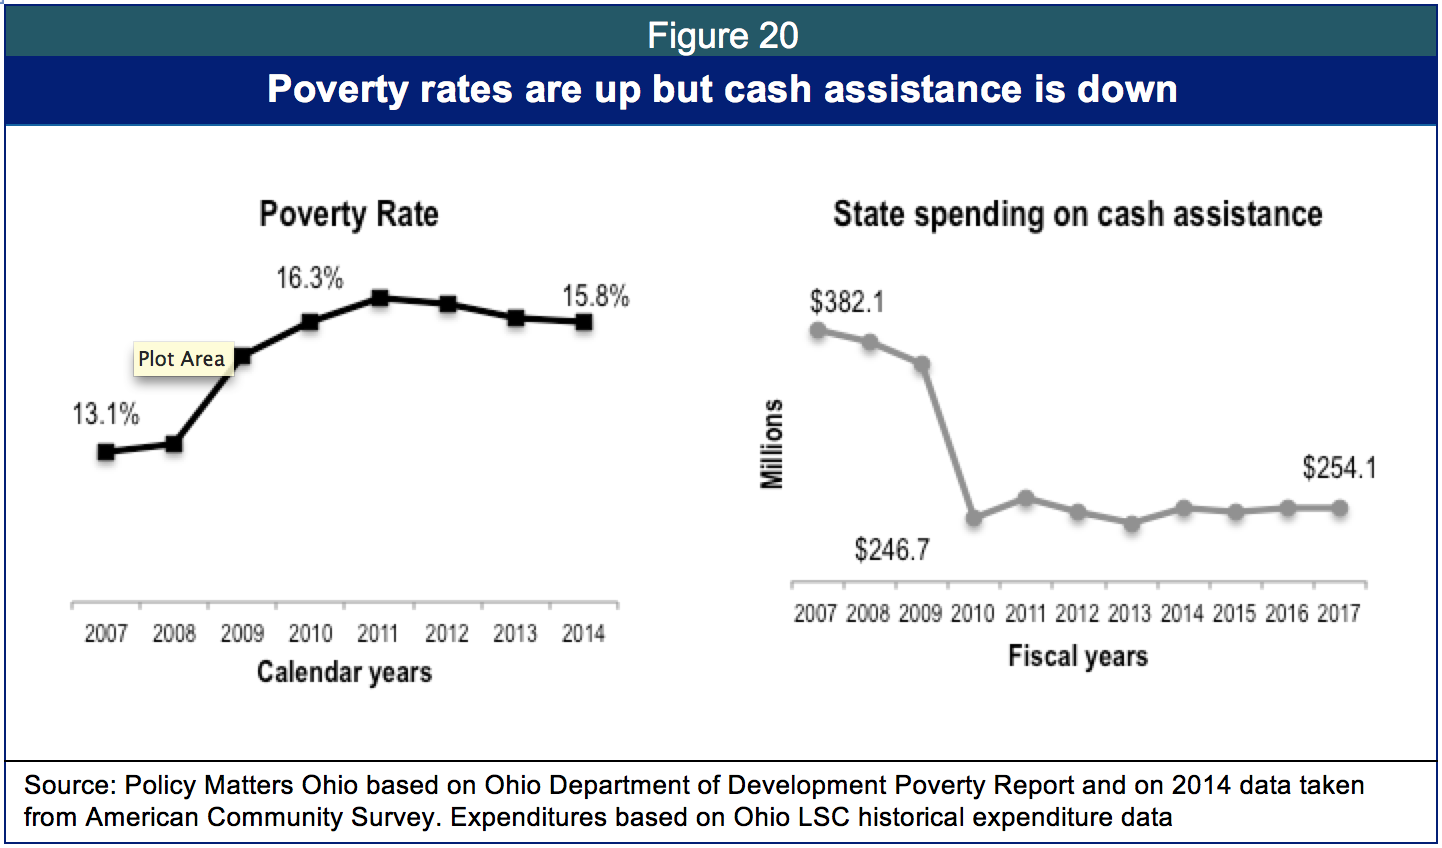
Less than 1 percent of state-source GRF funds help Ohio’s poorest through what is most typically thought of as welfare. Temporary Assistance to Needy Families (TANF) is funded by a $728 million federal block grant that the state matches with a smaller amount of state-source revenues. The TANF spending plan covers public childcare, state and local program administration, disability assistance and a variety of other earmarks in addition to providing cash assistance to families and a small number of adults in financial crisis. The share of state dollars used for cash assistance has dropped by a third over the past decade, even as poverty has grown (Figure 20).
The striking element in Figure 23 is that spending on aid to struggling families was an important public service that was not restored in the recovery, despite high poverty levels. The federal TANF block grant itself has shrunk in inflation-adjusted terms. Today, it is so eviscerated that on a national basis, just 23 of every 100 poor families received TANF benefits in 2014, down from 68 of every 100 poor families in 1996.[57]
More than 1.7 million Ohioans (15.8 percent) lived in poverty in 2014, according to the U.S. Census Bureau’s American Community Survey. More than 593,000 Ohio children — nearly one of every four — lived in poverty in 2014. Poverty is particularly high in Ohio’s minority communities, where more than 34.7 percent of African Americans and 28 percent of Latinos lived in poverty in 2014.[58]
The level of poverty in Ohio remains higher than before the recession, but the share of people helped by Ohio’s cash assistance program, Ohio Works First, has declined precipitously. The number of children in Ohio Works First dropped by 42.5 percent between January 2011 and September 2015. The number of adults dropped by 76.5 percent (Figure 21).
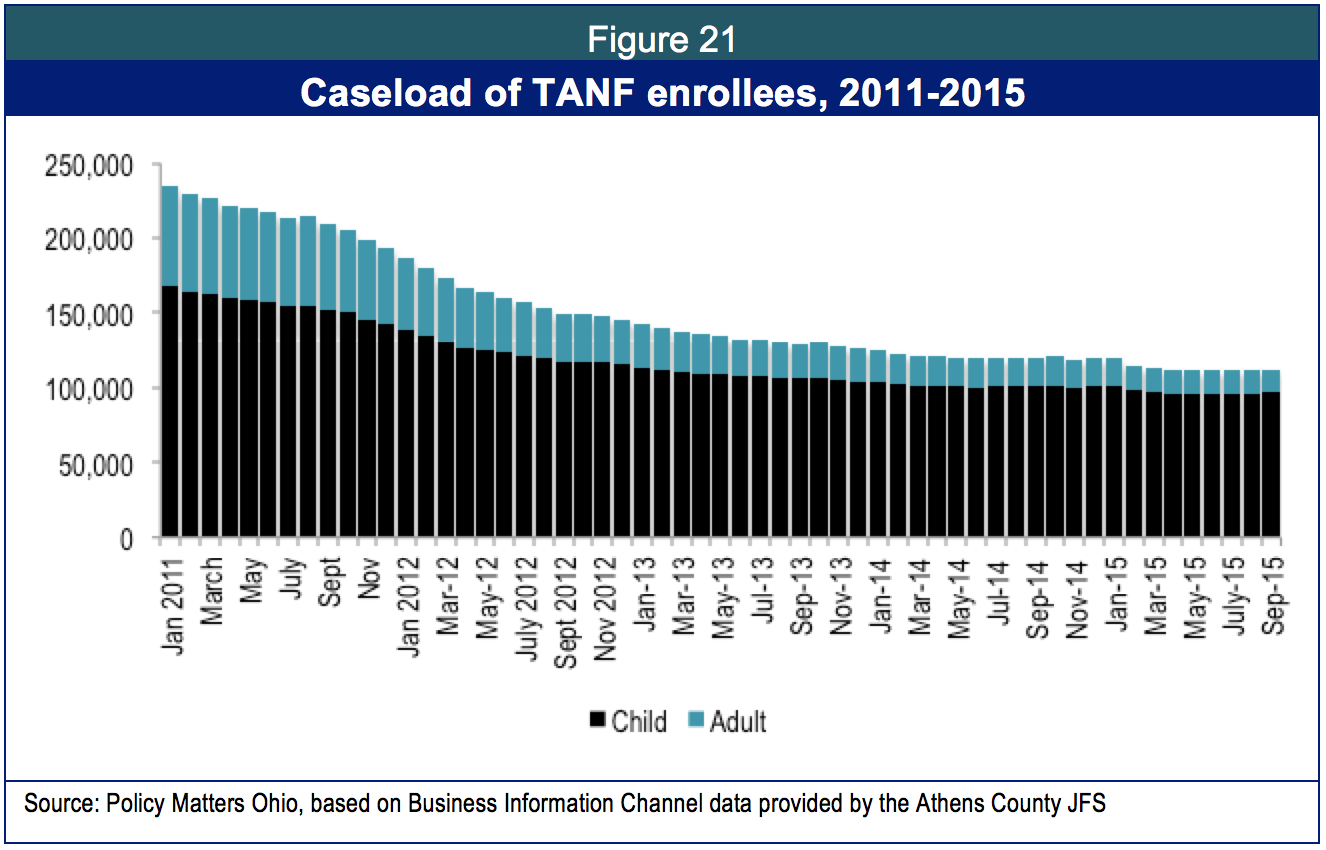
Caseloads plummeted as funds for program administration fell[59] and revenue sharing with local government – including counties and human service levies – was slashed. Ohio’s Department of Job and Family Services commissioned the Public Consulting Group to find out why the caseload was dropping. Its report found that county managers had instituted practices to improve the work participation rate by shrinking the overall caseload not through additional job placements but through stringent sanctioning and tight restrictions on qualifying in the first place.[60]
In three quarters of Ohio counties, the decline of adults in cash assistance in 2011 was steeper than the decline in unemployment. In one-third of counties, this rate of decline was more than 50 percent greater than any drop in unemployment. People were not getting jobs. They were being sanctioned off the program at a rate as high as 36 percent at one time – much higher than the national average.[61]
Legislators have focused on public assistance in the past year. In 2014 no less than six commissions, study groups and committees were established around the issue. Legislators held hearings, convened stakeholders and focused on local service delivery. Testimony discussed evaluations, incentives and privatization. Outcomes have been elusive. The number of Ohioans getting help through this system remains at record lows although poverty remains high.
In the 2016-17 budget, the Kasich administration suggested a new safety net model with an integrated information system that would free staff from eligibility paperwork so they could focus on case management. The new Comprehensive Case Management and Employment Program (CCMEP) is expected to align the TANF and workforce development systems at the local level in order to help young people with barriers to employment gain marketable skills and decent work. At the same time, charitable and religious communities will be tapped to help families as they transition from federal assistance, supported by grants given by “Healthy Buckeye Councils” in the counties.[62]
The CCMEP will be funded with $115 million from two federal sources (Temporary Assistance for Needy Families or TANF and Workforce Investment Opportunity Act, or WIOA). Funding from the TANF spending plan incorporates unspent monies from prior years. The Healthier Buckeye Councils will be funded over the next two years with $11 million in state-source (GRF) grant funds.
The new information technology upon which the program is predicated will not be in place before the end of the biennium.[63] The CCMEP will start incrementally, without the information technology, in July 2016, with local plans due to the state by May 2016. Services will initially be limited to youth. The program is expected to serve about 30,000 between age 16 and 24.
The new CCMEP program, for all the committees and hearings, will help just a fraction of struggling families. The program will not be implemented during this budget period. Instead, a pilot program will help youth and young adults.
Inflation has eviscerated federal allotment of the safety net, and Ohio is not providing enough funds of its own to help the neediest. Instead, billions of dollars are being prioritized as income tax cuts for Ohio’s wealthiest. [64]
Ohio’s legislature has dramatically reduced assistance at the bottom of the income scale and dramatically increased it at the very top. The state needs a new strategy based on aid for the neediest and most vulnerable and expanded opportunity for Ohioans other than the richest 1 percent.
Corrections
Ohio’s criminal justice system is strained. In August 2015 there were 50,433 inmates in the system and 38,579 beds – 31 percent over capacity.[65] Prison population has grown slowly since the start of the recession, rising from 49,889 in January 2008 to 50,370 in October 2015.[66] Needs are high among the prison population. There are ten times as many inmates with mental illness in Ohio prisons as there are patients in Ohio’s six psychiatric hospitals, making the state’s prisons the largest provider of mental-health services in Ohio.[67]
In his budget letter to the governor in preparation for the 2016-17 budget, ODRC Director Gary Mohr requested strengthened language for early release to reduce overcrowding of Ohio’s prison system. [68] GRF funding for ODRC has fallen at an average of 1 percent a year in inflation-adjusted dollars. Funding in the 2016-17 budget period is $326.7 million less in inflation-adjusted dollars than during the 2008-09 budget period (Figure 22).
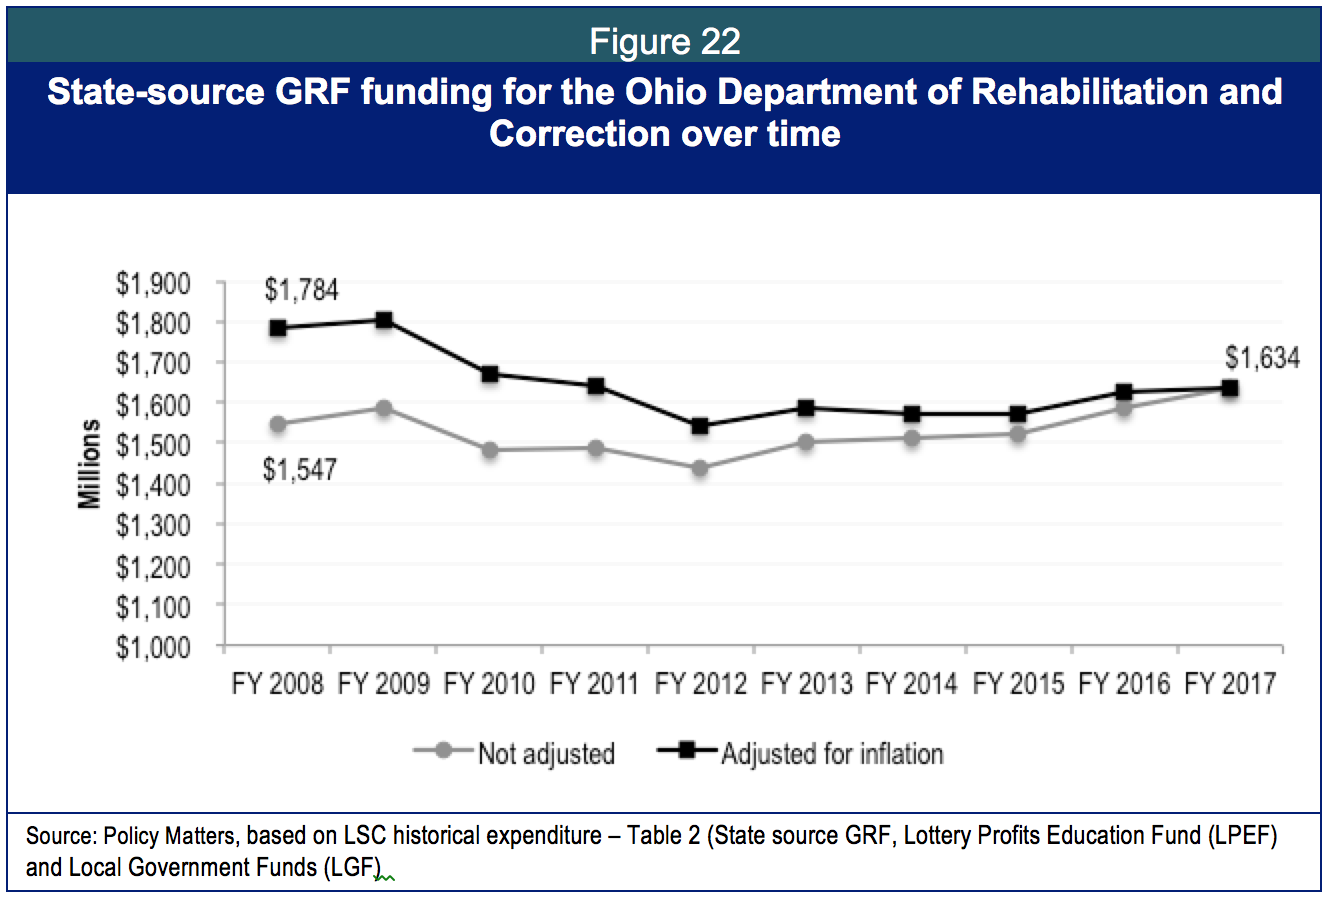
The budget for 2016-17 will boost spending by $187 million, an increase of 6.2 percent over the 2014-15 budget, but even that increase does not lift spending to 2008 levels, although inmate population has grown.
In 2012-13, Ohio reduced public control over prisons. The population in public prisons has fallen by nearly 3,000 since 2008, but the population in private prisons has increased by a similar amount. Population projected through 2023 grows to more than 52,000, in both the “as is” model and in a model that shows expanded community corrections.[69] This includes population in private prisons.
The Kasich administration may expand privatization further. Since the budget passed, the state sold the physical facility of an institution that has been under private operation. A 2011 Policy Matters investigation revealed that privatization of prison services risked higher state costs and lower quality.[70] In the past year, maggots were found in privatized food services in the prisons.[71]
Despite overcrowding and rising costs, Ohio’s legislature continues to increase penalties and criminalization. A coalition recommended Ohio lawmakers not introduce bills that would place additional criminal penalties into state law until the 24-member Criminal Justice Recodification Committee completes recommendations on Ohio’s complicated criminal code system. However, in just the first seven months of the 2015-16 legislative session, one in 11 bills introduced in the Senate and one in eight in the House would enhance, create, or expand criminal penalties. According to a report of the American Civil Liberties Union on the situation, “With more offenses accompanied by steep felony charges, more people—especially people of color—must bear the stigma of being a felon. This makes it nearly impossible to obtain housing, employment, and educational opportunities, relegating them to the outskirts of society. It is no surprise that many of these people, who have no hope nor prospects for the future, commit new crimes and are back in our prisons and jails. Ironically, while so-called ‘tough-on-crime’ laws might be intended to improve public safety, they only undermine it.”[72]
Department of Youth Services
The number of juveniles incarcerated by the Department of Youth Services declined sharply since 2008 and the budget dropped as well. GRF appropriations fall by 4 percent, about $18 million (not adjusted for inflation) in the two-year budget period for 2016-17 compared to the prior budget period. At the same time, incarceration of youth has dropped dramatically, from 1,884 in 2008 to 522 in 2015. Therefore, the primary decline is in funding for institutional services, which fell from a high of $133 million in 2009 to $77 million in 2017. Funding for community correctional facilities services for juveniles rose to $44.4 million in House Bill 64 compared to $35 million in the prior budget.
Ohio’s approach for reducing youth incarceration is a national model. Ohio has five programs that incentivize courts to house young offenders locally instead of in correctional facilities, including the Youth Services grant, RECLAIM, the Behavioral Health and Juvenile Justice (BHJJ) programs, Targeted RECLAIM, and Competitive RECLAIM. These support local community-based alternatives to incarceration.
While the number incarcerated in state facilities has declined, Ohio does not have a comprehensive data system that tracks all children in the 88 counties’ juvenile courts. It is hard to know if funding for the community system is adequate or if the correctional facility population decline has resulted in more financial strain for local programs or agencies.
Ohio should be proud to have reduced youth imprisonment. At the same time, we should make sure that the children’s service system is adequately funded, particularly if that system is expected to assist kids who might otherwise have been in the criminal justice system. We should use savings from these smart approaches to reinforce community-based programs and increase understanding of what does and doesn’t work.
Summary and conclusion
House Bill 64 made some important investments that started to replace deep cuts over the past decade. But it continued to slash taxes for the wealthiest and underfund services. Personal income taxes were cut for the richest and for investors in pass-through organizations. The top 1 percent of the income spectrum, who made at least $388,000 last year, will receive half of the total income-tax cuts under the bill, enjoying, on average, an annual tax cut of $10,236. Middle- and low-income families get paltry savings or even pay more.
This policy is not working. A decade after major income-tax cuts, Ohio’s job growth continues to lag far behind the rest of the nation’s. Nor have more recent tax reductions, including across-the-board income-tax rate cuts and the creation of the business-income tax break since 2013, led to relative job gains. Between June 2005, when the income tax cuts began, and June 2015, Ohio lost jobs while the nation’s employment base grew by almost 6 percent.
House Bill 64 took baby steps toward improving programs that need massive investment. Small improvements in public childcare are helpful, but lawmakers need to return initial eligibility to 200 percent of poverty, helping poor families get ahead. Funding for poor college students rose, but it would take more than $300 million over the biennium to return to pre-recession levels. Funding for the state’s share of instruction, which has a direct impact on tuition, is $1.2 billion behind where it was in the two-year budget period for 2008-09 after adjustment for inflation.
Our expenditure on cash assistance plummeted as the level of poverty in the state rose. It hasn’t been restored. Our funding for corrections dropped while prison population rose. The state’s largest-ever investment in adult protective services -- about $5.3 million over the biennium -- pales in comparison to need, estimated by advocates to be $20 million annually.
Local government, local health and human service levies, libraries, emergency services and other local functions supported by state revenue sharing and tax reimbursements face another loss of funds, this time of $124 million. In many cases – like in the case of adult protective services – the loss to local levies offsets new state investment.
We’ve invested in the wealthiest with little to show for it. We’ve disinvested in services that could broaden opportunity and improve the economy.
Yet House Bill 64 is a better budget than we’ve seen during much of the decade. The economy is growing, although we trail national growth. Medicaid has been expanded, allowing hundreds of thousands of Ohioans to see a doctor. There are some much-needed restorations in schools, colleges and universities. But Ohio continues to underinvest in its future.
[1] Amy Hanauer, “Left Behind: State of Working Ohio 2015,” Policy Matters Ohio, September 2015 at http://www.policymattersohio.org/sowo-aug2015. (Accessed October 1, 2015).
[2] Center for Law and Social Policy, “The Budget Deal and Low-Income People: A Welcome Down Payment on Needed Investments,” October 27, 2015 at http://www.clasp.org (Accessed October 28, 2015).
[3] Ohio’s “state fiscal year” – the period of time used in the Ohio budget – runs from July 1 through June 30. This is different from the standard “calendar year,” which runs from January 1 to December 31.
[4] Policy Matters Ohio et.al., Joint Statement on Ohio’s Shale Severance Tax, Sept. 30, 2015, at http://www.policymattersohio.org/fracktax-sept2015-2. See also Wendy Patton, “A Fair and Adequate Severance Tax,” Policy Matters, September 2015 at http://www.policymattersohio.org/wp-content/uploads/2015/09/A-fair-and-adequate-severance-tax.pdf
[5] Full report, “Well-off are winners in tax plan,” June 26, 2015, at http://www.policymattersohio.org/taxplan-june2015
[6] Patton, Wendy, “Ohio State and Local Taxes Hit Poor and Middle Class the Hardest,” Policy Matters Ohio, Jan. 14, 2015, at http://www.policymattersohio.org/tax-report-jan2015
[7] Schiller, Zach, “The Great Ohio Tax Shift,” Policy Matters, Aug. 18, 2014, at http://www.policymattersohio.org/tax-shift-aug2014. This report found that major tax changes between 2005 and 2014 had reduced the average amount of state and local taxes paid by the top 1 percent of Ohioans by more than $20,000 a year, while middle-income residents saw an average increase of $65 and the bottom 20 percent averaged a $138 increase.
[8] Governor John R. Kasich, Tax Expenditure Report, The State of Ohio Executive Budget Fiscal Years 2016-2017, at http://obm.ohio.gov/Budget/operating/doc/fy-16-17/State_of_Ohio_Budget_Tax_Expenditure_Report_FY-16-17.pdf
[9] Schiller, Zach, “Tax Breaks Expand in State Budget,” Policy Matters Ohio, Sept. 16, 2015, at http://www.policymattersohio.org/taxbreaks-sept2015
[10] Ironically, in approving this expanded tax break, legislators increased taxes for 2015 on some business owners. This year only, the budget bill called for the 3 percent flat rate to apply to 25 percent of the first $250,000 in business income that can’t be deducted. That’s a higher rate than what many business owners have been paying under Ohio’s graduated income tax. The General Assembly inadvertently demonstrated how such a progressive tax is beneficial to lower-income Ohioans with this bill. It moved quickly to approve Senate Bill 208, which reduced taxes on those business owners who would have had to pay more. The Legislative Service Commission estimated the additional cost at $76 million. See Russ Keller, Legislative Service Commission, Fiscal Note & Local Impact Statement, S.B. 208 of the 131st G.A., As Passed by the House, Oct. 27, 2015, at https://www.legislature.ohio.gov/legislation/legislation-documents?id=GA131-SB-208
[11] See also Ken McCall, “Job Gains Small from Tax Break,” Dayton Daily News, Oct. 20, 2015, at http://www.mydaytondailynews.com/news/news/local/job-gains-small-from-tax-break/nn6hh/?source=ddn_rotator_sidebar_2-4
[12] Schiller, Zach, “Testimony to the Senate Ways & Means Committee on House Bill 9,” Policy Matters Ohio, Oct. 7, 2015, at http://www.policymattersohio.org/hb9testimony-oct2015
[13] Energy Information Administration, Long-term projections at http://www.eia.gov/beta/aeo/#/?id=13-AEO2015.
[14] United States Energy Information Administration at http://www.eia.gov/petroleum/drilling/
[15] Testimony to the 130th Ohio General Assembly’s House Ways and Means Committee January 22, 2014 at http://www.ohiohouse.gov/committee/ways-and-means. Cited in Wendy Patton, “Severance tax does not meet Ohio’s needs,” Policy Matters Ohio, June 17, 2014 at http://www.policymattersohio.org/hb375-june-9-2014
[16] See “Ohio flat tax mandate is unwise, unwarranted,” Policy Matters Ohio, June 22, 2015, at http://www.policymattersohio.org/flattax-june2015
[17] United States Bureau of the Census, Table R1701 (Percent of People Below Poverty Level in the Past 12 Months (For Whom Poverty Status is Determined), American Factfinder at https://www.census.gov/acs/www/data/data-tables-and-tools/ranking-tables/
[18] Brie Zeltner, “Ohio ranks 45th nationally in infant mortality, near bottom for deaths of black babies,” August 6, 2015 at http://www.cleveland.com/healthfit/index.ssf/2015/08/ohio_ranks_45th_nationally_on.html. (Accessed 11/3/15).
[19] The Health Policy Institute of Ohio’s 2014 “Health Value Dashboard” ranks Ohio 47th among the states…” with Ohioans living less healthy lives and spending more on health care than people in most other states.” http://www.healthpolicyohio.org/tools/dashboards/ (Accessed November 3, 2015.) “Health value” includes measures of both the well being of the population and expenditures on health care
[20] Rich Exner, “Ohio Ranks 36th for College Degrees,” Northeast Ohio Media Group, September 24, 2015 at http://www.cleveland.com/datacentral/index.ssf/2015/09/ohio_ranks_36th_for_college_de.html (Accessed 11/3/15).
[21] State of Pre-school 2014, National Institute for Early Childhood Research, Table 2: Pre-K Access by State, http://nieer.org/sites/nieer/files/Yearbook2014_full3.pdfAccessed December 14, 2015).
[22] Amy Hanauer, Left Behind: State of Working Ohio 2015, Policy Matters at http://www.policymattersohio.org/sowo-aug2015. (Accessed 11/3/15).
[23] The Pew Charitable Trust evaluated total state expenditures as a share of state personal income and found state-source spending across all states dropped by an average of .4 percent in 2011 compared to 2008. It dropped twice as much in Ohio. By 2012, Ohio’s spending of state funds across major accounts (including and beyond the General Revenue Fund) as a share of income ranked 34th among the 50 states and the District of Columbia and reflected the national average. Pew Charitable Trust, “Fiscal 50: State Trends and Analysis, updated April 2014 at http://www.pewtrusts.org/en/multimedia/data-visualizations/2014/fiscal-50#ind2
[24]Robert Higgs, “State boosts rainy day fund by $526M, now has $2B plus in reserve for budget troubles,” Plain Dealer, July 9, 2015 at http://www.cleveland.com/open/index.ssf/2015/07/state_boosts_rainy_day_fund_by.html
[25] Changes to the income tax code to fix the small business tax break in Senate Bill 208 will reduce the Local Government Fund by an additional $1.3 million in 2016 and by $300,000 annually thereafter. The Ohio Legislative Commission’s fiscal note can be obtained at https://www.legislature.ohio.gov/legislation/legislation-documents?id=GA131-SB-208
[26] The loss of TPP funds hit townships particularly hard: by $20 million during the fiscal years 2016 and 2017 compared to 2014-15. So the diversion of the municipal local government fund backfills revenue sharing loss for townships and shifts the loss to municipalities.
[27] Ohio Municipal League Legislative Bulletin, June 26, 2015 at http://www.omlohio.org/Bulletin/Archives/2015%20archive.pdf
[28]The City of Maple Heights was a national epicenter of foreclosures during the recession. Recent revaluation of property values found a drop of 33 percent in the community, lowering property tax revenues by $3 million. Loss in state revenue made it worse, costing another $3 million in income over three years. The city turned to red light cameras and tickets but voters turned back those approaches. The city was placed in a state of fiscal emergency in the spring of 2014. See James Ewinger, “Ohio puts Maple Heights on fiscal watch, mayor blames state and county,” The Plain Dealer, April 10, 2014 at http://www.cleveland.com/metro/index.ssf/2014/04/maple_heights_placed_under_fis.html and Laura Atassi, “Cleveland, Maple Heights voters smack down red light cameras, Northeast Ohio Media Group, November 5 2015 at http://www.cleveland.com/metro/index.ssf/2014/11/cleveland_maple_heights_voters.html
[29] This data is based on agency line items 600617, 600689, 600535, 600413, 600696, 200661 and 200408. Provided by ODJFS Office of Communications in e-mail dated 10/1/2015. Notes: 1) Historical numbers are drawn from JFS Child Care & Learning budgets SFY 2008-2017 for TANF Spending Plans and other lines per actual budget expenditures. 2016 &2017 represent appropriations. 2) Child care federal (600617) excludes Race to the Top. 3) TANF (600689) excludes Early Learning Initiative. TANF 2008-09 (direct charge child care) includes Market Rate. 4) Early care & education (600535) 2016-2017 excludes Payment After Denial & out-take 300% of poverty level.
[30] National Institute for Early Education Research, “State of Preschool 2014,” Rutgers University, at http://nieer.org/sites/nieer/files/Yearbook2014_full2_0.pdf
[31] Ohio served 106,198 children in the public childcare program in fiscal year 2008 and 114,910 in 2014. We can expect to serve higher numbers in 2016 and 2017 as eligibility has been broadened.
[32] Ohio Public Assistance Monthly gives annual count of children served through public childcare on a fiscal and calendar year basis. Provider reimbursement rates are in the Child Care and Development Block Grant plan for the state.
[33] Administration for Children and Families, United States Department of Health and Human Services, “Increasing Quality in Early Care and Education: Effects on Expenses and Revenues,” https://childcareta.acf.hhs.gov/sites/default/files/public/240_1411_pcqc_increase_quality_final_0.pdf
[34] LSC Greenbook for the Ohio Department of Job and Family Services, http://www.lsc.ohio.gov/fiscal/greenbooks131/jfs.pdf
[35] Based on the Ohio Legislative Service Commission’s table: “Primary and Secondary Education Funding, GRF, Lottery Profits, and TPP Reimbursement and Supplement Funds, 8/5/2015, provided in e-mail from Jason Phillips, 8/5/2015. Includes federal stimulus $. FY 2015, 2016 and 2017 are estimates.
[36] Ohio Department of Education, “Primary and Secondary Education Funding, FY 2009-2017 at http://education.ohio.gov/getattachment/Topics/Finance-and-Funding/Overview-of-Funding-2014/ed_chart_rev_big.jpg.aspx. 2008 from Aaron Rausch of the Ohio Department of Education in e-mail to Nick Albares of the Center on Budget and Policy Priorities, December 4, 2015.
[37] Formula funding, as historically tracked by the Ohio Legislative Services Commission, includes GRF funding, but also revenues provided through the Lottery Profits Education Fund and reimbursements for the Tangible Personal Property Tax, a component of the local property tax that was eliminated over the past 15 years.
[38] Ohio Department of Education, Op.Cit.
[39]According to Education Tax Policy Institute’s Dr. Howard Fleeter, average daily membership (ADM) in Ohio’s schools was 1.7 million students, which includes 122,395 community and STEM school students. E-mail of December 3, 2015.
[40] Patrick O’Donnell, “Ohio's charter schools ridiculed at national conference, even by national charter supporters” The Plain Dealer, March 2, 2015 at http://www.cleveland.com/metro/index.ssf/2015/03/ohios_charter_schools_ridicule.html (accessed November 4, 2015);
[41] Id; see also Akron Beacon Journal’s review of 4,263 audits released last year by State Auditor Dave Yost’s office found charter schools misspend public money nearly four times more often than other taxpayer-funded agencies. Doug Livingston, “Charter schools misspend millions of Ohio tax dollars as efforts to police them are privatized,” Akron Beacon Journal, May 30, 2015 and updated June 3, 2015 at http://www.ohio.com/news/local/charter-schools-misspend-millions-of-ohio-tax-dollars-as-efforts-to-police-them-are-privatized-1.596318, see also http://www.dispatch.com/content/stories/editorials/2015/06/02/1-open-up-the-books.html (accessed October 20, 2015).
Margaret Raymond of Stanford University’s Hoover Institute found that Ohio charter school students learn 36 days less math and 14 days less reading than traditional public school students. And Valerie Strauss, “Troubled Ohio charter schools have become a joke — literally,” The Washington Post, June 12, 2015 at https://www.washingtonpost.com/news/answer-sheet/wp/2015/06/12/troubled-ohio-charter-schools-have-become-a-joke-literally/
[42] Wendy Patton and Zach Schiller, Hard Times at City Halls, Ohio Communities Struggle with Damaged Tax Base and State Cuts,” Policy Matters Ohio, January 2015 at http://www.policymattersohio.org/hard-times-jan2015 (accessed November 4, 2015).
[43] Wendy Patton, “Ohio Schools Cautiously Rebuild,” Policy Matters, April 2015 at http://www.policymattersohio.org/schools-april2015 (accessed 11/5/15). Also Jim Segal, Will Ohio ban pay-to-play school activities?” The Columbus Dispatch, September 21, 2015 at http://www.dispatch.com/content/stories/local/2015/09/21/time-for-a-ban.html. Segal reports: “ A 2014 survey by the Ohio High School Athletic Association found that 46 percent of athletic directors said their schools had some type of pay-to-play fee, up from 42 percent in a 2011 survey. Central Ohio has the highest percentage of schools charging the fees, at 63 percent, while northeastern Ohio has the highest average rates, at $153 per sport or activity.”
[44] Educational attainment in Ohio has increased dramatically over the last generation and during the recovery, but the median wage has not responded in kind. See, Amy Hanauer, “Left behind: State of Working Ohio 2015, ” Policy Matters, September 2015, available at http://www.policymattersohio.org/sowo-aug2015, (accessed 9/23/15).
[45] Noah Berger and Peter Fisher, “A Well-Educated Workforce is Key to State Prosperity,” Economic Policy Institute, August 2013, available at http://www.epi.org/publication/states-education-productivity-growth-foundations/, (accessed September 23, 2015.)
[46] The College Board, Annual Survey of Colleges, In-state Tuition and Fees for 2015-16, Table 5, available at http://trends.collegeboard.org/college-pricing/figures-tables/tuition-and-fees-sector-and-state-over-time-1, Tuition and Fees by Sector and State, accessed November 10, 2015. Tuition and fees, in 2015 dollars, at Ohio’s two-year public schools are the 14th highest in the nation. The state is the 16th most expensive for four-year public colleges and universities.
[47] According to the Legislative Services Commission Green book for the Ohio Board of Regents, “In both FY 2016 and FY 2017, the budget freezes tuition at the FY 2015 rate for all state-assisted institutions. In FY 2014, the weighted average tuition was $10,030 for university main campuses, $5,605 for regional campuses, and $3,816 for community and technical colleges.” (http://www.lsc.ohio.gov/fiscal/greenbooks131/bor.pdf). But Ohio’s 2 year and 4 year public institutions remain pricy. According to the College Board’s “Trends in Higher Education” for 2015-16, (http://trends.collegeboard.org/college-pricing/figures-tables/tuition-and-fees-sector-and-state-over-time-1), Ohio ranked 16th among the states in 4-year public institution fees and tuition and 12th in terms of two-year public schools.
[48] The plan also relies on privatization, which often leads to higher costs and less value for students. See, “Action Steps to Reduce College Costs,” Ohio Task Force on Affordability and Efficiency, October 1, 2015, available at https://www.ohiohighered.org/sites/ohiohighered.org/files/uploads/affordability-efficiency/Action-Steps-to-Reduce-College-Costs_100115.pdf, accessed October 12, 2015.
[49] See, “2015 Ohio Higher Education Report,” Ohio Conference of American Association of University Professors, available at http://www.akronaaup.org/documents/OCAAUP2015.pdf, accessed November 2, 2015.
[50] John Carey, Chancellor, Ohio Department of Higher Education, formerly known as Board of Regents, Letter to Budget Director Tim Keen, October 31, 2014.
[51] Health Policy Institute of Ohio, 2014 Health Value Dashboard for Ohio at http://www.healthpolicyohio.org/tools/dashboards/ (Accessed November 18, 2015).
[52] The federal government pays about $.75 of each Medicaid dollar spent on kids; $.90 of each dollar on selected services, like family planning, and 100% of each dollar spent on the Medicaid expansion population in 2016.
[53] LSC Greenbook for HB 64 at http://www.lsc.ohio.gov/fiscal/greenbooks131/mcd.pdf, accessed November 1, 2015.
[54] MetroHealth Medical Center in Cleveland was able to get an indication of benefits of Medicaid Expansion by starting a pilot program similar to expanded Medicaid, called MetroHealth Care Plus, in February 2013. Steven Koff reported in September of 2014: “Enrolling 28,000 uninsured people in Cuyahoga County, the share of MetroHealth's gross revenues from patients who lacked any coverage and were classified as self-paying dropped from 17 percent in 2012 to 10 percent in 2013, the hospital said. MetroHealth's charity care – free care, with costs it had to try to recover elsewhere or write off -- dropped by half, going from $268 million in 2012 to $132 million in 2013. MetroHealth has traditionally treated a large share of low-income patients and struggled several years ago to meet financial projections. But its pilot program and the expansion of Medicaid this year helped it boost its credit rating to stable, with upgrades from Standard & Poor's, Moody's and Fitch Ratings.”(http://www.cleveland.com/open/index.ssf/2014/09/obamacare_is_helping_ohio_hosp.html).
[55]Office of the Assistant Secretary for Planning and Evaluation, “Financial Condition and Health Care Burdens of People in Deep Poverty,” July 16, 2015, http://aspe.hhs.gov/basic-report/financial-condition-and-health-care-burdens-people-deep-poverty. Laura Dague, “The effect of Medicaid premiums on enrollment: A regression discontinuity approach,” Journal of Health Economics 37 (2014) 1–12; Brendan Saloner, Ph.D., Lindsay Sabik, Ph.D., and Benjamin D. Sommers, M.D., Ph.D, “Pinching the Poor? Medicaid Cost Sharing under the ACA,” New England Journal of Medicine, March 27, 2014; .Joseph Newhouse, Free For All? Lessons from the Rand Health Insurance Experiment, Cambridge: Harvard University Press, 1996, cited in Leighton Ku and Victoria Wachino, “The Effect of Increased Cost- Sharing in Medicaid.” July 2005 at http://www.cbpp.org/cms/?fa=view&id=321, and Wendy Patton, “Making Medicaid Work, February 2015 at http://www.policymattersohio.org/medicaid-feb2015;
[56] The Governor’s Office of Health Transformation estimated a much larger monthly premium proposed by the governor in the executive budget would raise just $1.6 million in 2016 and $3.2 million in 2017. See Office of Health Transformation fact sheet, “Modernize Medicaid Eligibility,” at http://www.healthtransformation.ohio.gov/LinkClick.aspx?fileticket=yOkp04xrGu8%3d&tabid=252
[57] Ife Floyd and Liz Schott, “TANF benefits have fallen by more than 20 percent in most states and continue to erode,” Center on Budget and Policy Priorities, October 15, 2015 at http://www.cbpp.org/research/family-income-support/tanf-cash-benefits-have-fallen-by-more-than-20-percent-in-most-states
[58] Hannah Halbert, “More Ohioans working but poverty rate hasn’t improved,” Policy Matters Ohio, September 17, 2015 at http://ww.policymattersohio.org/ohcensus-sept2015
[59] Joel Potts, “Ohio Benefits System Update to the Joint Medicaid Oversight Committee, Ohio Job and Family Services Directors Association, October 15, 2015, cited in Gongwer Ohio, October 16, 2015. According to Potts, the allocation for Income Maintenance (public assistance program administration and operation) dropped across Ohio’s 88 counties from $151 million in 2007 to $72 million in 2015, a loss of $80 million dollars.
[60] PCG, “Ohio Works First work participation improvement project, May 2013 at http://jfs.athensoh.org/documents/recommendationsforimprovementstocountyagencyworkacti.pdf…..
[61] Wendy Patton, Shrinking Aid for Ohio’s Poorest, Policy Matters Ohio, November 2013 at http://www.policymattersohio.org/wp-content/uploads/2013/11/ShrinkingAidNov2013.pdf
[62] Presentation by Director Doug Lumpkin of the Office of Human Service Innovation, Ohio Department of Job and Human Services, at the Glenn School Leadership Academy, Ohio State University, September 28, 2015.
[63] Potts, Op.Cit.
[64] Of the $2.3 billion in income tax cuts provided in the 2016-17 budget, Ohio residents in the top one percent of the income spectrum, who made at least $388,000 last year, would receive half -- 50 percent -- of the total benefit.. See Zach Schiller, “Well off are winners in Ohio tax plan,” June 26, 2015 at http://www.policymattersohio.org/taxplan-june2015.
[65] http://www.drc.ohio.gov/web/Reports/FactSheet/August%202015.pdf
[66] Ohio Department of Rehabilitation and Correction, Monthly Rehabilitation Factsheet
[67] Health Policy Institute of Ohio, citing the Columbus Dispatch, April 19, 2015, at http://www.healthpolicyreview.org/daily_review/ohio-budget/
[68] Alan Johnson, “Emergency Release of Prisoners is Considered,” The Columbus Dispatch, January 4, 2015.
[69] Memorandum to Prison Director Gary Mohr at http://www.drc.ohio.gov/web/Reports/projections_december2014.pdf
[70] Bob Paynter, “Prison privatization risks higher costs for Ohio,” December 15, 2011 at http://www.policymattersohio.org/wp-content/uploads/2011/12/PrisonDec2011.pdf
[71] Jeremy Pelzer, “Maggots found in four Ohio prison kitchens: Officials launch statewide investigation,” Northeast Ohio Media Group, July 14, 2014 at http://www.cleveland.com/open/index.ssf/2014/07/maggots_found_in_three_ohio_pr.html
[72] American Civil Liberties Union, New ACLU Report Shows Ohio Lawmakers Undermining Criminal Sentencing Reform Efforts, October 7, 2014 at http://www.acluohio.org/archives/press-releases/new-aclu-report-shows-ohio-lawmakers-undermining-criminal-sentencing-reform-efforts?c=168801
Tags
2015Basic NeedsBudget PolicyChild careWendy PattonPhoto Gallery
1 of 22