Survey shows: Ohio shrinks its schools
April 29, 2013
Survey shows: Ohio shrinks its schools
April 29, 2013
Download summary (2 pp)Download report (11 pp)Long-term investment in education is the best way to build opportunity for Ohioans. Instead, Ohio’s cuts to school funding have forced schools to get rid of staff, reduce pay, cut materials and increase class sizes.
Press release
State cuts lead to larger class sizes, fewer course offerings
Executive summary
 A large majority of Ohio school districts report that they have cut or frozen salaries and benefits, laid off staff, and cut back on classroom materials and supplies to deal with the loss of state funding since 2011. Students in many districts are facing larger class sizes, reduced course offerings, and an increase in “pay-to-play” requirements for extra-curricular activities.
Long-term investment in education remains the best way to build opportunity for Ohioans and help create an economy that works for everyone. A new Policy Matters survey shows that shortsighted cuts made to education funding when the legislature passed the current biennial budget in June 2011 have reduced educational quality for Ohio’s public school students. State policymakers, currently working on Ohio’s next budget, should craft a stronger, more predictable school funding system for the next two years and beyond.
Shortfalls on the rise
The table below shows that more districts reported cuts for the 2012-13 school year than for the previous year, and even more expect shortfalls and cuts next year unless they get new state funding.
Nearly 60 percent of districts responding to the survey said they had faced a shortfall for 2012-13, and had made cuts to balance the budget, up from the nearly half that reported shortfalls last year. The table shows that in each year, a substantial percentage reported no shortfall but nevertheless detailed cuts in staffing, compensation levels or other areas. More than 60 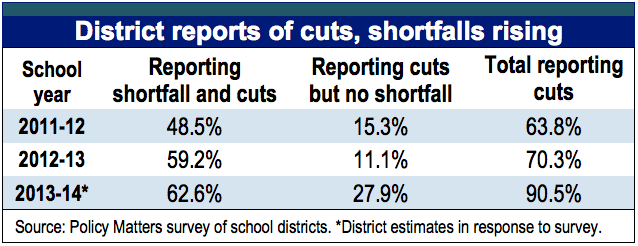 percent of respondents said they anticipated a shortfall next year unless they get new state funds. Another 28 percent said they expected no shortfall but would make cuts without new funds. It is likely that these districts reported no shortfall because they had already balanced their budgets by making cuts.
Survey documents damage from cuts
When asked how they were dealing with reduced resources for the 2012-13 school year, most districts making cuts reported that they lowered costs by freezing pay, changing the salary schedule, reducing employee benefits, laying off staff or leaving positions unfilled. This follows roughly the same strategies, in the same proportion, that districts reported implementing for the 2011-12 school year. For the current school year, slightly more districts said they cut costs by reducing compensation or benefits. By comparison, slightly more districts reduced the size of the workforce in 2011-12.
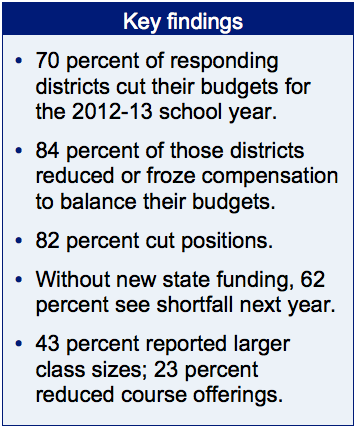
Of the 70 percent of responding districts that reported cuts for 2012-13:
- Eighty-four percent said they reduced or froze compensation;
- Eighty-two percent said they reduced staff.
Of the 64 percent of districts that reported cuts for 2011-12:
- Seventy-eight percent said they reduced or froze compensation;
- Eight-four percent said they reduced staff.
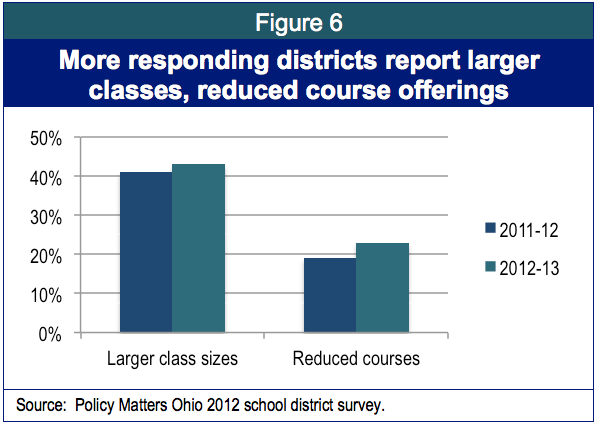
Many districts reported larger class sizes and reduced course offerings for 2012-13:
- Forty-three percent reported larger class sizes, slightly more than last year;
- Twenty-three percent had reduced course offerings, compared to 19 percent last year.
While cuts in compensation and staffing levels were the most common reported approaches used to address shortfalls, a majority of districts also said they cut materials, supplies, textbooks or equipment. In addition, many reported implementing or increasing pay-to-play requirements for extracurricular activities, or reducing these offerings.
- Materials – 57 percent said they cut materials, supplies, textbooks or equipment for this school year, up from 53 percent in 2011-12;
- Extracurricular activities – 22 percent said they introduced pay-to-play or reduced extracurricular offerings, up from 15 percent for the 2011-2012 school year.
Levies and income tax increases
When this survey was completed in the fall, districts did not expect relief in the state budget. At that time, 28.7 percent (75 of 261 respondents) anticipated going to the polls before the end of 2013 to help with the fiscal pressures. Of that group, 77 percent anticipated property tax levies and 23 percent expected income tax increases. Major urban districts with high poverty and urban/suburban districts with higher median incomes were more likely to report that they would go to the polls.
About the survey
In October 2012, Policy Matters asked the Ohio Association of School Business Officials to distribute a 15-question survey to its members about district finances. Forty-three percent – 261 of the state’s 609 K-12 districts – responded, representing districts from 82 of Ohio’s 88 counties.[1] Responding districts enroll 646,358 students, 40 percent of the state’s 1,612,625 students attending K-12 district schools.[2] The survey asked for responses specific to three school years: 2011-12, 2012-13, and 2013-14. For a copy of the survey, see Appendix A.
Ohio shrinks its schools
Introduction
Both Gov. John Kasich and the Ohio House have proposed overall increases to state funding for K-12 education as they have begun putting together the biennial budget for fiscal years 2014-15. Neither proposal is sufficient, however, and the process is far from over. The current proposals include targeted funding, such as the proposed Straight-A Fund, and expand funding for charter schools and voucher programs, and are likely to leave many districts with less state funding. As a result, unless the Senate steps in with a stronger proposal, it is likely that K-12 districts’ need for additional state funding will not be met in the coming budget.
To put school funding proposals for the coming biennium into perspective, it is important to take a step back and look at the overall trend. Figure 1 shows the change in school foundation funding over 10 years, including an estimate of the impact on the proposed budget for fiscal years 2014-15, adjusted for inflation. Ohio’s schools will end up in fiscal year 2015 about $1.2 billion behind where they would have been if the state had merely kept up with inflation, in spite of increases proposed so far for the coming biennium.
About the survey
Cuts made in 2011 to state funding for Ohio’s primary and secondary schools caused shortfalls and forced hard choices on districts.[3] In the fall of 2011, Policy Matters Ohio surveyed school district finance officers and other administrators, asking how they were handling those cuts. We conducted a second survey in the fall of 2012, asking school district administrators to report on conditions heading into the second year. The results show that cash reserves have been spent down, compensation and staffing have been cut and changes have been made to facilities, maintenance and transportation plans. The impact has deepened in the classroom as more schools have fewer teachers, materials, textbooks and equipment, and less funding for ancillary activities like arts, team sports and other extracurricular activities.
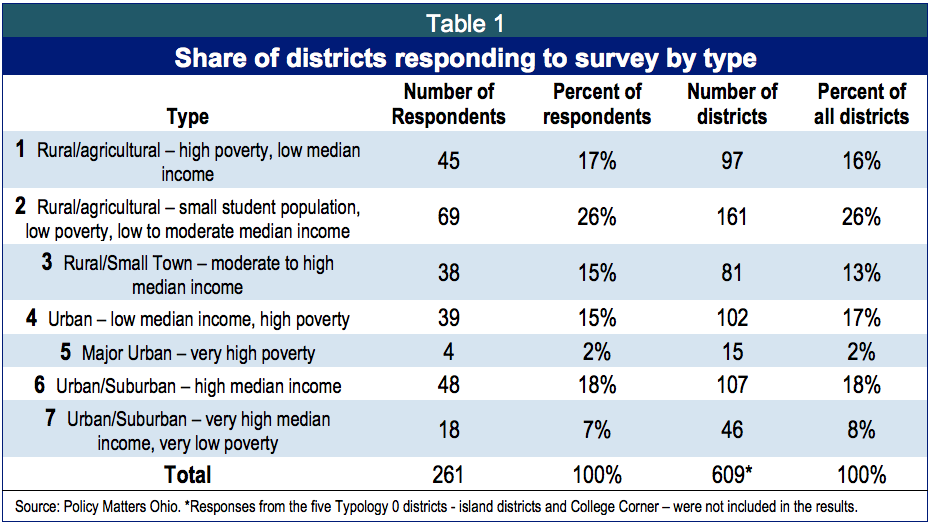
The 2012 survey, distributed for Policy Matters Ohio by the Ohio Association of School Business Officials, was a 15-question survey about fiscal conditions at the district level and strategies districts were using to address budget shortfalls. Forty-three percent – 261 of the state’s 609 primary and secondary school districts – responded, representing districts from 82 of the 88 Ohio counties and from seven district types (called “typologies” by the Ohio Department of Education).[4] The number of school districts responding in each category more or less matched the percentage of all districts of each type (Table 1).[5]
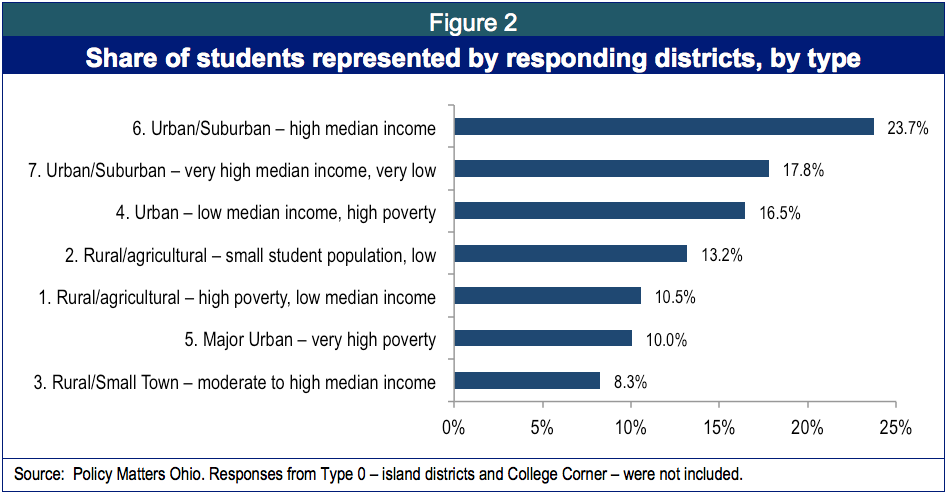
Responding districts enroll 646,358 students, 40 percent of the 1,612,625 students attending Ohio K-12 district schools.[6] Respondents from type 6 (urban/suburban schools of high median income) represented the greatest share of total students, with 23.7 percent or 156,543 students. The smallest grouping, representing 8.3 percent of the students of all respondents, came from type 3 (rural, small town school districts of moderate to high median income). Figure 2 illustrates the proportion of students represented by responding districts, grouped by type.
Sixty-three percent of total enrollment of responding districts is from communities with median to high income and 37 percent of student enrollment represented by respondents is from low-income districts.
Shortfalls on the rise
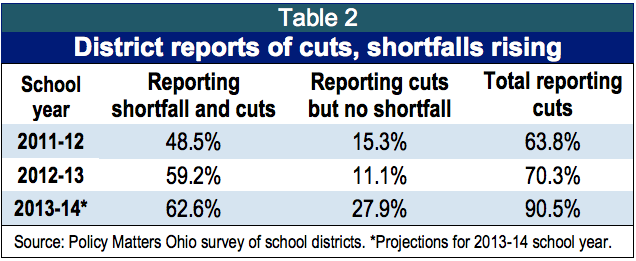 Survey respondents reported no end in sight for budget cuts. Table 2 shows that almost half reported that they made cuts to meet budget shortfalls in 2011-12. That already staggering number rose more than 10 percentage points for the current school year. Most districts said they anticipated shortfalls for the 2013-14 school year, with almost two-thirds projecting that more cuts will have to be made unless additional state funds are provided for the coming school year.[7] Table 2 also shows the substantial percentages of respondents indicating that they did not face shortfalls but nevertheless had made cuts or planned to do so for the coming year. For 2011-12, 15 percent of respondents said they had no shortfall, but detailed cuts made; for 2012-13, 11 percent answered the survey this way; for the coming school year, 28 percent reported no anticipated shortfall but said they expected to make cuts. It is likely that these districts reported no shortfall because they had already balanced their budgets by making cuts.
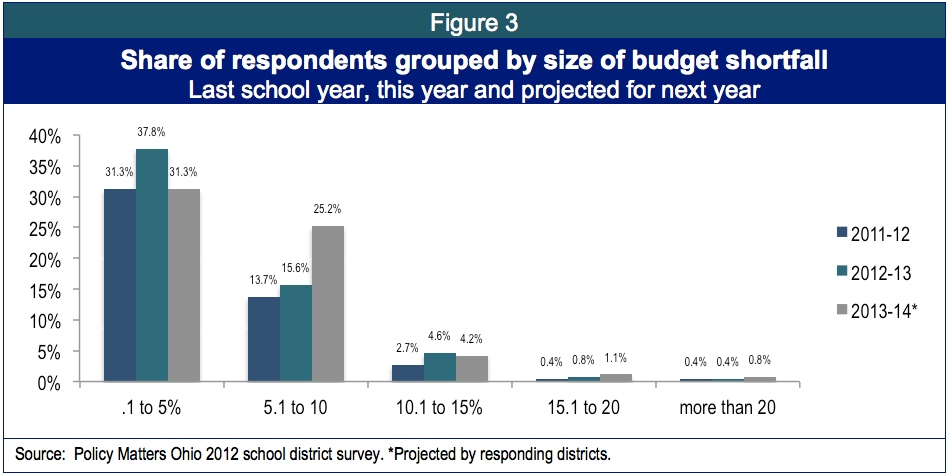
The size of budget shortfalls is growing as well, illustrated by Figure 3. For the 2011-12 school year, slightly less than one-third of districts reported a budget shortfall of up to 5 percent, and another 14 percent of districts expected gaps of between 5 and 10 percent. For the current school year, nearly 38 percent of districts reported shortfalls up to 5 percent and another 15 percent expect a gap between 5 and 10 percent. For next year, nearly a third of districts anticipate a gap under 5 percent, and another quarter expect a larger gap of between 5 and 10 percent. Finally, for both this year and next more than 5 percent of districts expect a gap even larger than 10 percent.
Cuts to staffing, compensation
Education is labor intensive, so districts facing a budget squeeze often turn first to cutting pay or cutting staff. When asked how they were dealing with the cuts, more than 80 percent of respondents said they were freezing or cutting pay, reducing employee benefits, or reducing the number of employees for 2012-13; this follows roughly the same strategies, in the same proportion, that districts reported implementing for the 2011-12 school year.
Of the 70 percent of districts that reported cuts for 2012-13:
- 84 percent said they reduced or froze compensation (59 percent of all respondents, including those reporting no shortfall or not answering);
- 82 percent said they reduced staff (57 percent of all respondents).
Of the 64 percent of districts that reported cuts for 2011-12:
- 78 percent said they reduced compensation (50 percent of all respondents);
- 84 percent said they cut staff (53 percent of all respondents).
Figure 4 shows that the most common way to deal with the funding cuts at the district level involved reducing compensation – both pay and benefits.
Cuts in pay, benefits and staffing occurred across all district types and in higher proportion in the current school year compared to the prior. Table 3 shows that all district types resorted to these labor-cost-cutting strategies. Every district type scrimped on staffing in these ways, and by this year more than half of the districts in every district type, and 60 percent of districts overall, were turning to these techniques. In types 5 and 6 – the high poverty major urban districts and the higher income urban or suburban districts – a shocking 73 and 75 percent of the districts made these cuts.
By type
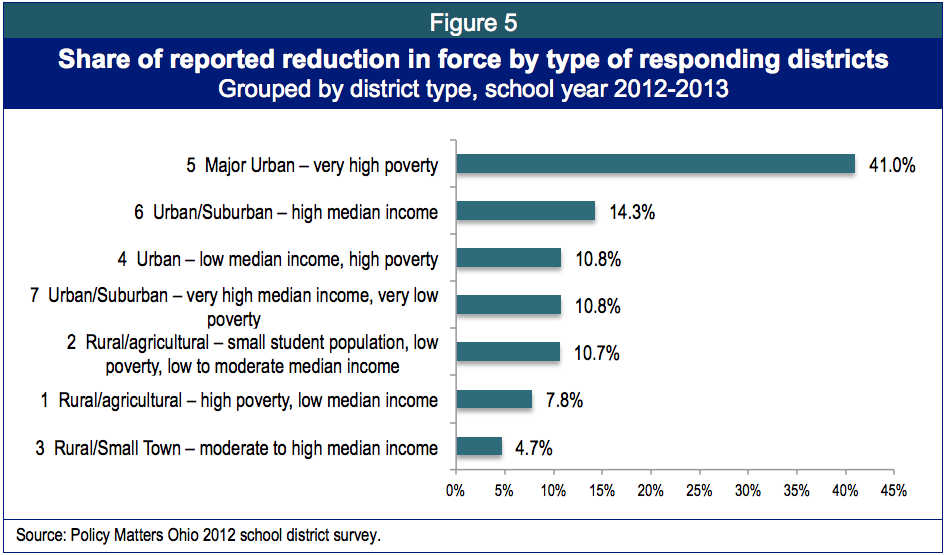
Respondents reported eliminating 1,570 positions in 2012-13. Figure 5 shows that the greatest loss occurred in the very large urban districts with high poverty, which accounted for 41 percent of total reduction in force reported. If the reduction in force reported by the responding school districts is representative, as many as 3,651 positions have been eliminated from Ohio’s schools this year.
Classroom impact
 Not surprisingly, the Policy Matters survey found that budget cuts have a direct impact on students in the classroom.
Figure 6 shows that a shocking 43 percent of districts reported larger class sizes for the 2012-13 school year, up slightly from the previous year. Twenty-three percent of responding districts said they reduced course offerings this year, up from 19 percent last year. These trends are a likely consequence of decisions to reduce staffing (layoffs and leaving open positions unfilled).
Cuts not related to labor costs also have a direct impact in the classroom. Figure 7 shows that districts were already cutting materials and extracurriculars in 2011-12, and that even more did so in 2012-13.
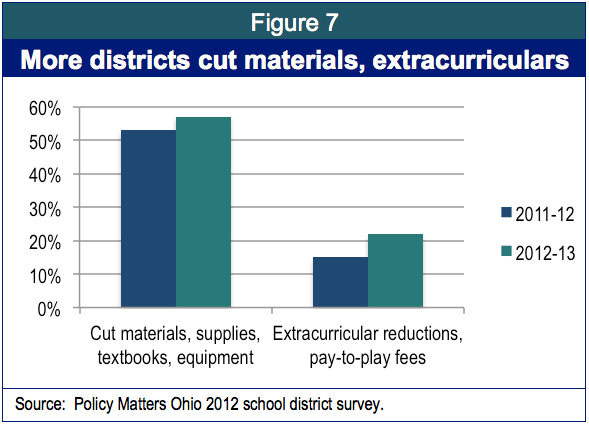 For the current school year, 57 percent said they cut spending on materials, supplies, textbooks or equipment, up from 53 percent the previous year. A similar increase was reported in the percentage of districts reporting that they introduced or increased pay-to-play fees for extracurricular activities, or reduced those activities; 22 percent reported making these changes for the 2012-13 school year, up from 15 percent in 2011-12. While these cuts vary slightly by type, the increase in pay-to-play requirements is especially prevalent in high-income districts, and large urban districts.
Levies and income tax increases
When this survey was completed in the fall, districts did not foresee relief in the state budget. At that time, 28.6 percent (75 of 262 respondents) anticipated going to the polls before the end of 2013 to help with the fiscal pressures. Of that group, 77 percent anticipated property tax levies and 23 percent expected income tax increases.
Table 4 shows that major urban districts with high poverty levels and urban/suburban districts with higher median incomes reported being more likely to go to the polls.
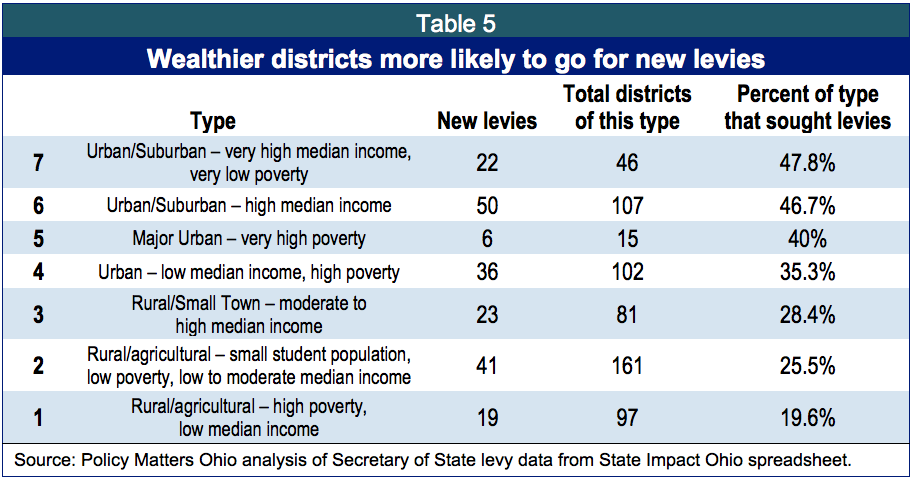
Levy data from 2012 showed similar results, according to a separate analysis based on districts that actually went to the polls last year.[8](Table 4, above, reflects survey results about future plans.) Table 5 shows that urban and suburban districts with higher incomes went to the polls in disproportionate numbers, while lower-income, rural districts were less likely to go to the polls. For example, nearly half of the 46 Type 7 districts in the state (urban/suburban, very high median income, very low poverty) asked voters for new levies in 2012, while fewer than 20 percent of Type 1 districts (rural/agricultural, high poverty, low median income) made new levy requests that year.
The results of this analysis should not be surprising, as wealthier districts may feel that their constituents have more resources and therefore may be more likely to go to voters for support. But these results are nevertheless distressing, because they indicate that disparities in funding for schools will increase based on local ability to pay, thereby reinforcing the already-strong differences in opportunity that exist across Ohio districts.
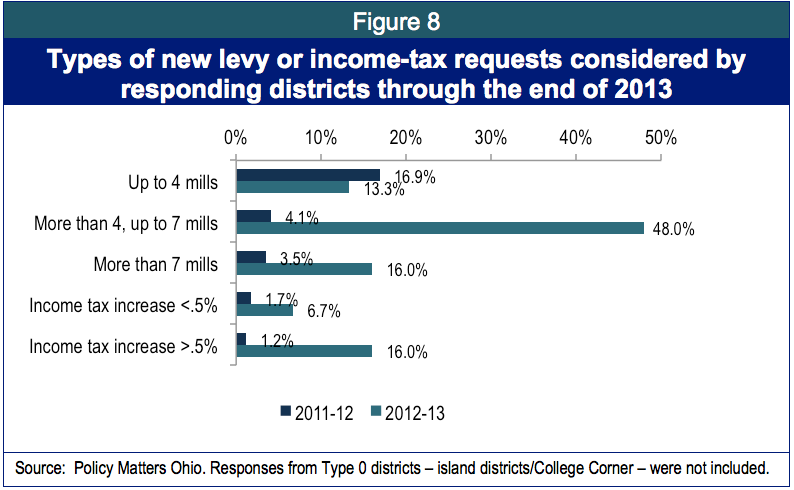
The 2011 Policy Matters district finance survey found that the great majority of districts – 72.7 percent – were not headed to the polls to ask voters to approve new local revenue.[9] That number has dropped only slightly this year, with 67.8 percent of respondents reporting that they had no plans to go to the polls before the end of 2013 to ask voters to approve new levies or income taxes that would raise the rates district residents pay for schools. Figure 8 shows that of the remainder – districts reporting that they would seek a new levy or an income-tax increase by the end of 2013 – nearly half said they would seek a levy of more than four mills, but not larger than 7.[10]
Conclusion
Ohio’s schools faced ongoing fiscal challenges in the second year of Ohio’s biennial budget period, after historic cuts were taken from revenue sharing and federal stimulus dollars were not replaced in the current budget. In response, districts have cut teacher salaries and benefits, not replaced positions, laid off teachers and other staff, and cut materials, supplies and equipment. As a result, class sizes are growing and districts are reducing course offerings. Some districts are also slashing funding for extracurricular activities such as sports, with districts increasingly implementing pay-to-play requirements or reducing extracurricular offerings.
Distress occurred within all district types represented in the survey this year. Some districts were considering going to the polls to preserve standards expected of their districts as they started to reduce course offerings and took other measures directly impacting students and their families.
Both Gov. John Kasich and the Ohio House have proposed overall increases to state funding for K-12 education as they have begun putting together the biennial budget for fiscal years 2014-15. But that process is far from over, and given the targeted nature of some of the possible increase – such as the proposed Straight-A Fund – and the apparent expansion of funding for charter schools and voucher programs in both version of the budget, it is not clear that K-12 districts’ need for additional state funding will be sufficiently met in the coming budget. Furthermore, the proposals put forward so far would keep school foundation funding nearly flat over a 10-year period, another indicator that Ohio falls short of the commitment needed to adequately fund it’s K-12 system.
Investment in education remains the best way to build opportunity for Ohioans. Today’s schoolchildren are bearing the brunt of the state’s shortsighted approach to education funding. Tomorrow’s economy may suffer as well, if our students are less prepared for the jobs of the future.
Interns Timothy O'Toole and Michelle Newman assisted with this report.
[1] Because of their unique characteristics, neither the four island districts nor College Corner Local School District were included in the results, although some of these districts did respond to the survey.
[2] Does not include students at charters, joint vocational districts, career centers or educational service centers. With those students, Ohio’s public enrollment is 1,762,722. Both totals based on Average Daily Membership from ODE website.
[3] These cuts were part of the current biennial budget, HB 153, for fiscal years 2012 and 2013.
[4] Because of their unique characteristics, neither the four island districts nor College Corner Local School District (Typology 0) were included in the results, although some of these districts did respond.
[5] The state department of education describes 8 different “typologies” – we use the word “type” but keep their numbers, which correspond to different levels of poverty and to the urban, suburban or rural characteristics of the district, described in Table 1.
[6] This total does not include students served by charter schools, joint vocational school districts, career centers or educational service centers. Including those students, Ohio’s total public school enrollment is 1,762,722. Both totals are based on Average Daily Membership numbers for 2011-12, downloaded from the Ohio Department of Education website.
[7] The question for the 2013-14 school year read as follows: If the state does not implement a new school funding formula for the 2013-14 school year that increases state funding to your district, do you anticipate a shortfall for that year? If yes, how much of a shortfall do you expect as a percentage of the district's total operating budget? (Please select "No shortfall", "Don't know/unsure" or pick a range.) See Appendix A for a full list of questions posed to districts.
[8] Analysis of 2012 levy results using Secretary of State data in a spreadsheet downloaded from State Impact Ohio. Policy Matters Intern Timothy O’Toole assisted with this analysis.
[9] Patton, Wendy, Piet van Lier and Elizabeth Ginther, "The State Budget and Ohio’s Schools," Policy Matters Ohio, January 2012. Online at www.policymattersohio.org/state-budget-ohio-schools-jan2012.
[10] The property tax rate is measured in mills; a mill is one tenth of a cent and is used in expressing tax rates on a per-dollar basis. This translates to $1 for each $1,000 of assessed property value.
Tags
2013Budget PolicyK-12 EducationPiet van LierRevenue & BudgetWendy PattonPhoto Gallery
1 of 22

