State support for higher education is still behind the curve
December 23, 2015
State support for higher education is still behind the curve
December 23, 2015
High tuition, low aid, too little state investment.
Contact: Wendy Patton, 614.221.4505
 A skilled workforce is one essential component of a prosperous and inclusive state economy. Attaining a degree or other post-secondary credential has obvious benefits to graduates and their families. Higher education insulates against unemployment and can be a pathway out of the low-wage economy.[1] Funding for higher education is correlated with increased productivity, increased wages and a more adaptable labor force for employers.[2]
At the height of the recession, the state cut support for public higher education institutions and drastically cut need-based financial aid. Even though the state has made some strides in holding down rising tuition and fees, Ohio remains one of the priciest states for both four-year and two-year public schools.[3] Not surprisingly, the state also has very high levels of student debt. In the 2016-17 budget, Ohio made progress toward reinvesting in higher education, but it is not enough to close the gap.
Ohio’s investment in higher education
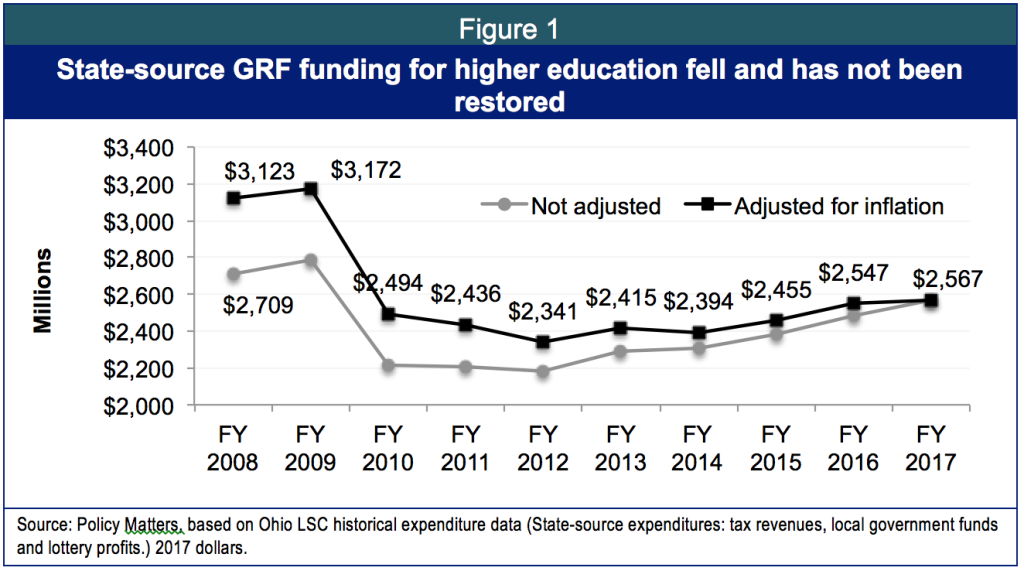
Our GRF investment in higher education has been reduced over the decade. Funding for 2017 is $556 million less or 18 percent lower than in 2008 (Figure 1). Biennial funding for the 2016-17 budget is $1.18 million less than in the 2008-09 budget (adjusted for inflation) -- about 19 percent lower.
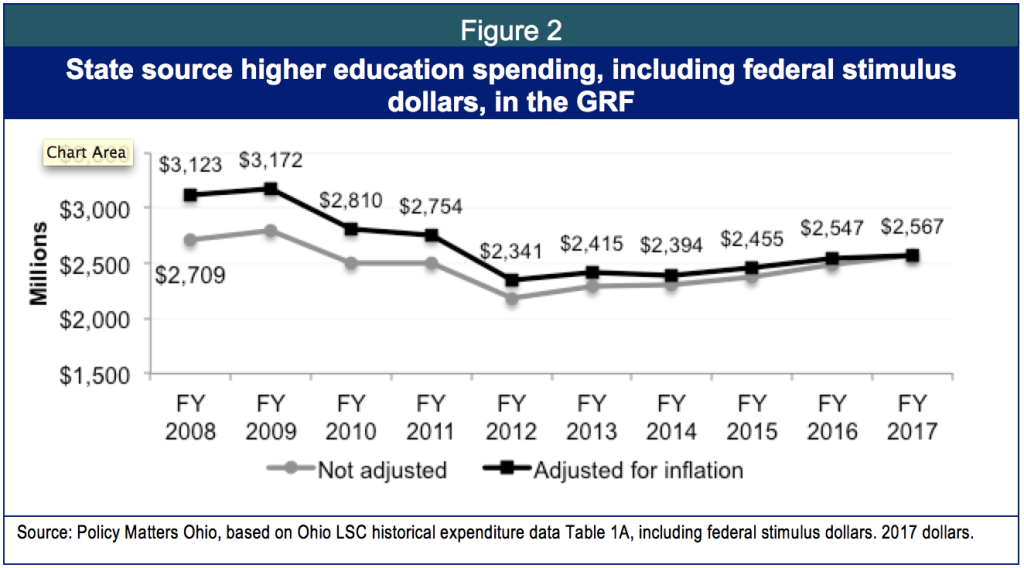
Figure 1 shows state support of higher education plummeted in 2010-11. State source spending dropped, but federal stimulus dollars of almost $600 million included in the GRF for higher education sustained colleges and universities during the two-year 2010-11 budget period. Figure 2 includes federal stimulus dollars placed in the GRF and illustrates how this resource was used to protect the budget for higher education during the budget for 2010-1.
The 2016-17 state-source GRF budget for higher education increases by $369 million dollars over the 2014-15 budget (not adjusted), an increase of 7.8 percent. This turns the trend in the right direction, but there is a long way to go, particularly in areas that directly impact the cost of college to Ohio families, like State Share of Instruction, which funds classroom teaching and operations, and need-based financial aid, which helps students from families of modest income go to college.
State support for public institutions
The state must reduce the cost of higher education so more students can access and complete degrees. Affordability is a make or break issue for students, both for enrollment and completion. The latest budget enacted a tuition freeze, holding tuition to 2015 levels for 2016 and 2017.[4] The budget bill also established review committees to find campus efficiencies and incentives for cutting costs and bringing down tuition. Institutions are mandated to submit plans that will reduce the cost of completing a degree by five percent.
An Ohio task force on higher education efficiency recently issued a report that suggests cutting the cost of college by reducing hours needed to complete a degree, increasing online courses, and creating “fast-track” programs.[5] These ideas raise concerns that should be explored by higher education experts because they reduce contact between students and the faculty who can provide them with meaningful education, so they may reduce quality and be counterproductive. The approach also often overlooks important drivers of cost like increases in administration and administration expense.[6] Ultimately, this approach does little to reverse the cost shift: it does nothing to rebalance costs between the two parties that benefit, the state and the student. As state direct support to higher education and financial aid dwindled, cost shifted to students. Chancellor John Carey addressed this in his budget letter during the months leading up to the passage of HB 64 writing, “If we are serious about holding down the cost of higher education, the state needs to do its share and continue to provide state support to our public colleges and universities to make education more affordable.”[7]
Ohio provides support for instruction and operations to public colleges and universities primarily through the “State Share of Instruction” (SSI) line item in the budget. As Figure 3 shows, this line dropped as the state cut higher education during and after the recession. The state used federal stimulus dollars of $281 million in 2010 and $308 million in 2011 to maintain this funding, so the big drop occurred in the budget for 2012-13. We are spending just about the same amount on higher education in 2017 as in 2008, but over the two-year 2016-17 budget period we will remain 2.5 percent below the level of spending in the 2008-09 budget, $102 million in inflation-adjusted dollars.
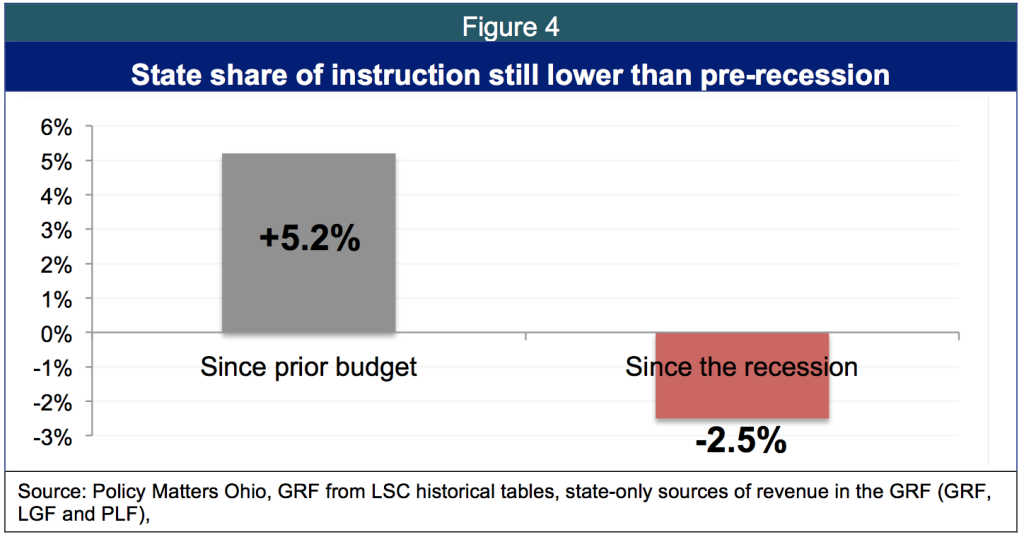
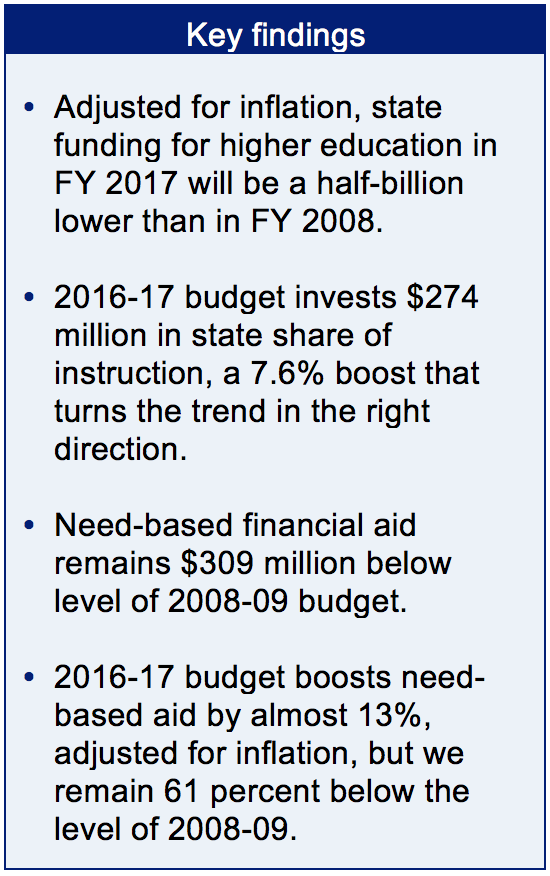
In the 2016-17 budget, Ohio increased SSI over the 2014-15 budget levels by $274 million or 7.6 percent (not adjusted for inflation).[8] This is a welcome change, but it does not fix the long-term problem. Using inflation-adjusted dollars, Figure 4 shows how SSI investment has changed relative to the prior two-year budget and relative to the budget period of a decade ago. Spending has increased significantly compared to the prior budget, but remains below the level of the 2008-09.
State support for need-based financial aid
Need-based financial aid is critical to expanding access and supporting student completion. It can make the difference between credential attainment and dropping out, with nothing more than debt for their efforts. It is important to keep in mind that Ohio’s public universities; branch campuses and community colleges are expensive compared to other states. This makes the need for robust need-based financial aid more important.
During the recession, legislators made draconian budget cuts and continued income-tax cuts, rather than taking a balanced approach and raising revenue to meet needs. Need-based financial aid was hit hard, losing more than half of its funding.
During these years, the state phased out the Ohio Instructional Grant and the Part-time Student Instructional Grant and replaced them with the Ohio College Opportunity Grant (OCOG). OCOG is now the state’s only source for need-based financial aid. The OCOG alone dropped more than $93 million (55 percent) from its recession peak in 2009 to 2012, when the cuts finally stopped.[9] The state did not supplement financial aid with federal stimulus dollars during the budget for 2010-11. OCOG dropped by 57 percent in 2010 and by another 20 percent in 2011.[10] The state also changed eligibility requirements for OCOG in 2009. These changes eliminated eligibility for students at public, two-year branch campuses and community colleges. This compounded the economic crisis for many. Rather than opening the door to the public institutions that provide relatively speedy, job-connected, workforce training, the state blocked the door.
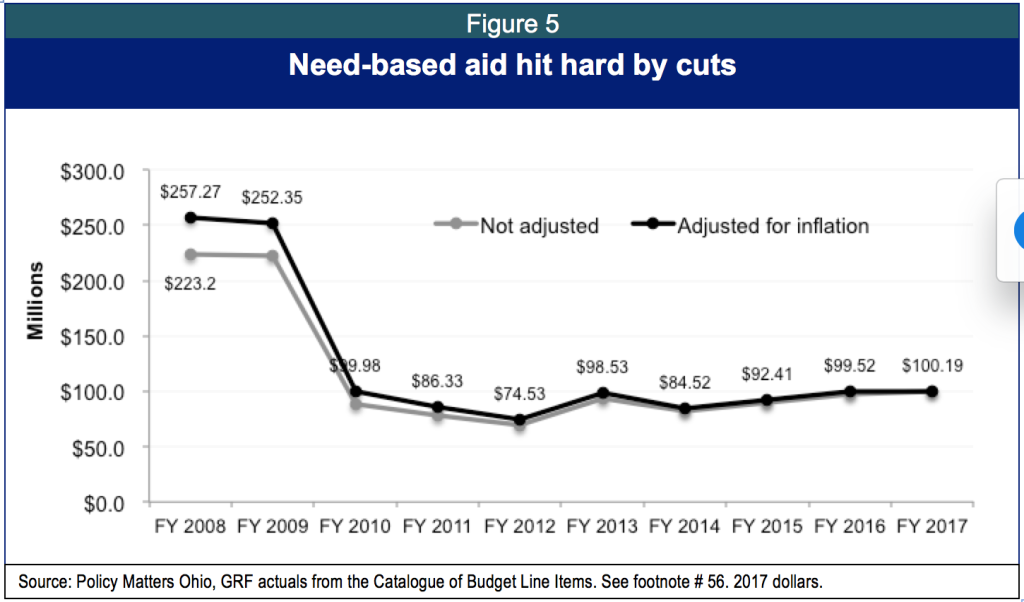
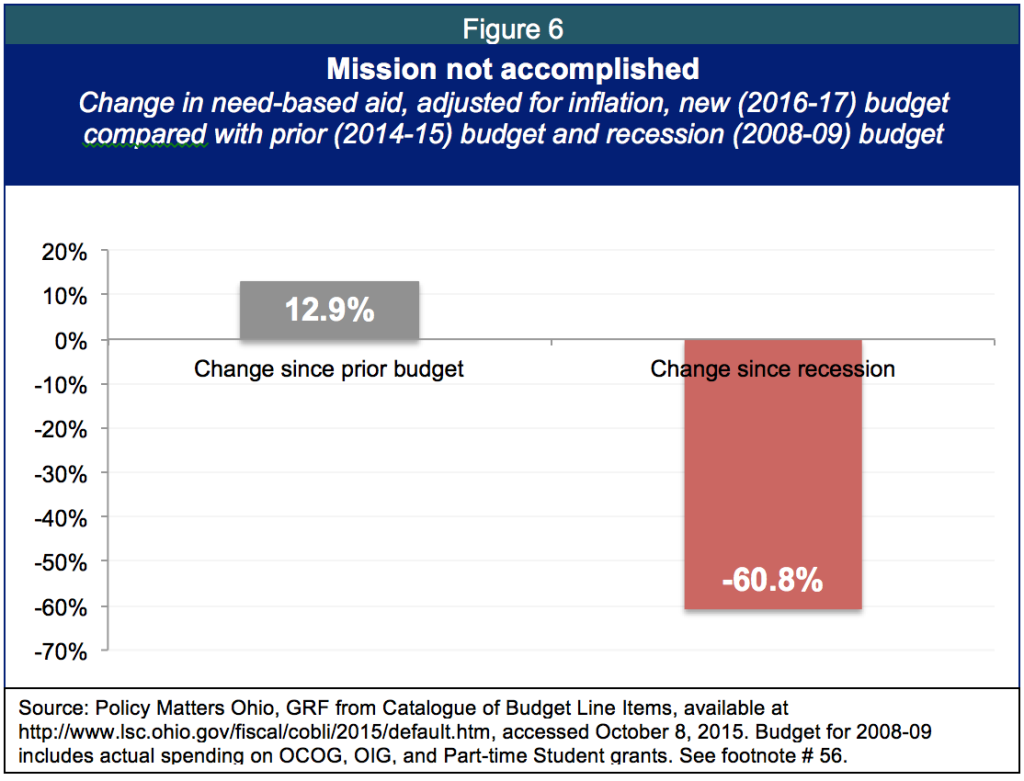
Figure 5 shows the change in total need-based financial aid since 2008. Funding for need-based financial aid in Ohio in the 2016-17 budget is $309 million less (adjusted for inflation) than in the 2008-09 budget.
Need-based student aid provided through the Ohio College Opportunity Grant rises in non-adjusted dollars by $26.4 million (15.4 percent) over the 2014-15 budget to $197.4 million for the biennium. The move puts the trend in the right direction, but there is a long way to go to get back to pre-recession levels.
The latest budget, while boosting need-based aid, remains $309 million below spending in the period for 2008-09.[11] The new budget bill restored some access, opening OCOG to students attending summer sessions at public two-year institutions, when federal Pell grants, the biggest source of federal aid for low-income students, is not available. These are steps in the right direction, but much more is needed to fully regain lost ground (Figure 6).
The biennial budget increases state support for higher education and financial aid, but it’s not enough. Ohio is still below pre-recession levels for both. Ohio has a world-class network of public universities, community colleges and branch campus institutions. Underfunding this public system and keeping financial aid low hampers long-term prosperity for workers and our state as a whole.
[1] Educational attainment in Ohio has increased dramatically over the last generation and during the recovery, but the median wage has not responded in kind. See, Amy Hanauer, “Left behind: State of Working Ohio 2015, ” Policy Matters, September 2015, available at http://www.policymattersohio.org/sowo-aug2015, (accessed 9/23/15).
[2] Noah Berger and Peter Fisher, “A Well-Educated Workforce is Key to State Prosperity,” Economic Policy Institute, August 2013, available at http://www.epi.org/publication/states-education-productivity-growth-foundations/, (accessed September 23, 2015).
[3] The College Board, Annual Survey of Colleges, In-state Tuition and Fees for 2015-16, Table 5, available at http://trends.collegeboard.org/college-pricing/figures-tables/tuition-and-fees-sector-and-state-over-time-1, Tuition and Fees by Sector and State, accessed November 10, 2015. Tuition and fees, in 2015 dollars, at Ohio’s two-year public schools are the 14th highest in the nation. The state is the 16th most expensive for four-year public colleges and universities.
[4] According to the Legislative Services Commission Green book for the Ohio Board of Regents, “In both FY 2016 and FY 2017, the budget freezes tuition at the FY 2015 rate for all state-assisted institutions. In FY 2014, the weighted average tuition was $10,030 for university main campuses, $5,605 for regional campuses, and $3,816 for community and technical colleges.” (http://www.lsc.ohio.gov/fiscal/greenbooks131/bor.pdf). But Ohio’s 2-year and 4-year public institutions remain pricy. According to the College Board’s “Trends in Higher Education” for 2015-16, (http://trends.collegeboard.org/college-pricing/figures-tables/tuition-and-fees-sector-and-state-over-time-1),
[5] The plan also relies on privatization, which often leads to higher costs and less value for students. See, “Action Steps to Reduce College Costs,” Ohio Task Force on Affordability and Efficiency, October 1, 2015, available at https://www.ohiohighered.org/sites/ohiohighered.org/files/uploads/affordability-efficiency/Action-Steps-to-Reduce-College-Costs_100115.pdf, accessed October 12, 2015.
[6] See, “2015 Ohio Higher Education Report,” Ohio Conference of American Association of University Professors, available at http://www.akronaaup.org/documents/OCAAUP2015.pdf, accessed November 2, 2015.
[7] John Carey, Chancellor, Ohio Department of Higher Education, formerly known as Board of Regents, Letter to Budget Director Tim Keen, October 31, 2014.
[8] GRF from LSC Historical tables, state-only sources of revenue in the GRF (GRF, LGF and PLF), available at http://www.lsc.ohio.gov/fiscal/revenuehistory/staterevenue.htm, accessed October 1, 2015. In constant dollars, comparing combined 2014 and 2015 spending to total 2016 and 2017 appropriations, as enacted. Fiscal year CPI index taken from BLS; FY 2016 and 2017 index calculated based on Global Insight.
[9] Policy Matters, GRF from the Catalogue of Budget Line Items available at http://www.lsc.ohio.gov/fiscal/cobli/2015/default.htm, accessed October 8, 2015. Comparing OCOG only spending, in constant dollars. In nominal dollars the drop was more than $78 million or 53 percent. Note: Policy Matters, GRF actuals from the Catalogue of Budget Line Items available at http://www.lsc.ohio.gov/fiscal/cobli/2015/default.htm, accessed October 8, 2015. References actual spending not appropriations. Total need-based aid includes all state sources of need-based financial aid, the Ohio College Opportunity Grant; Ohio Instructional Grants in 2008 and 2009, completely replaced by OCOG in 2010; Part time student instructional grants in 2008, replaced by OCOG in 2009; and OCOG Proprietary, which was funded only in 2012 and 2013. In 2009 OCOG received additional support from federal dollars through the College Access Challenge Grants. That funding is not included. Actual spending in 2008-09 in OIG and the part-time grants was higher than appropriated, while OCOG spending was lower, making the overall change from 2008-09 levels of need-based financial aid to the level appropriated for 2016-17 much more stark. These changes between appropriation and actual spending were in part due to changes in appropriations made after the budget bill was passed and some spending in the OIG lines that was appropriated in prior budgets but spent in 2008 and/or 2009.
[10] Ohio Legislative Service Commission, Green Book for the Ohio Board of Regents, House Bill 1 (the budget for fiscal years 2010-11).
[11] Over the previous budget need-based aid is up by more $22 million (12.9 percent), in constant dollars.
Tags
2015Budget PolicyHannah HalbertHigher EducationWendy PattonPhoto Gallery
1 of 22
